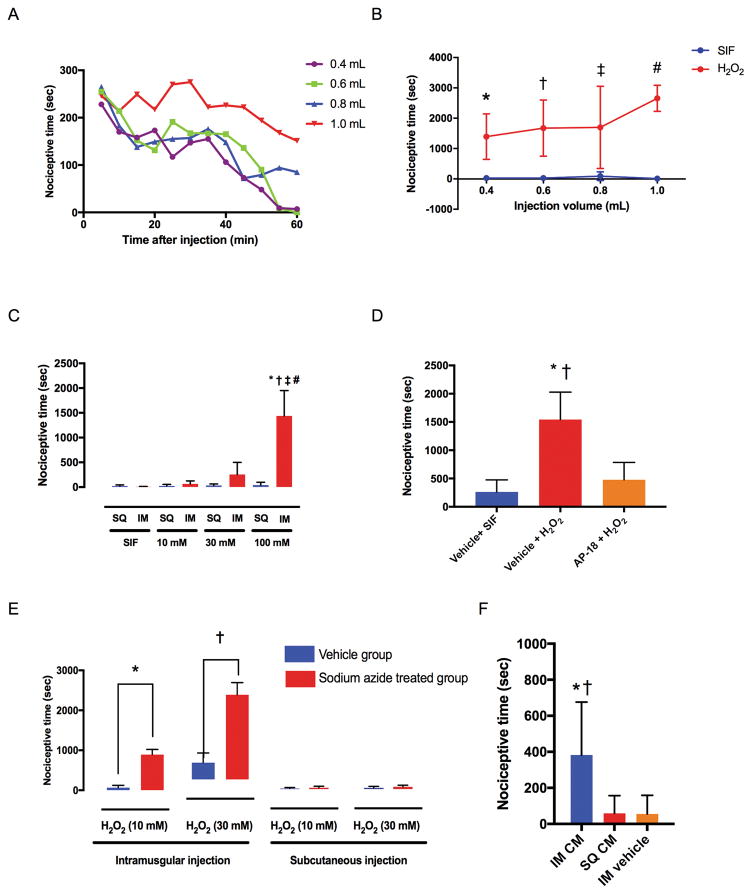
Fig. 1. Nociceptive behavior in rats as total time spent flinching, lifting and licking of the hind leg during a 60-minute period.
(A) Time-course of the nociceptive behavior after various volumes of 100 mM H2O2 were injected into the gastrocnemius muscle. Data were collected in 5-minute bins from six animals in each group. Data points show the average nociceptive time in 5-minute bins, and error bars were omitted for clarity. (B) Total time of nociceptive behavior over 60 minutes after various volumes of 100 mM H2O2 were injected into the gastrocnemius muscle (summarized data from Fig. 1A). Each group contained six rats. * P = 0.0035, † P = 0.0004, ‡ P = 0.0005, # P < 0.0001 compared with the SIF injection group by two-way ANOVA (interaction factor: F3, 40 = 2.227, P = 0.0999, Injection volume factor: F3, 40 = 2.022, P = 0.1263, Group factor: F1, 40 = 91.61, P < 0.0001) followed by post-hoc t-test with Bonferroni’s correction. (C) Spontaneous nociceptive behavior after various concentrations of 0.6 ml H2O2 were injected subcutaneously (SQ) or intramuscularly (IM). Each group contained six rats. * P < 0.0001 compared with the IM SIF injection group, † P < 0.0001 compared with IM 10 mM H2O2 injection group, ‡ P < 0.0001 compared with IM 30 mM H2O2 injection group, # P < 0.0001 compared with SQ 100 mM H2O2 injection group by one-way ANOVA (F7, 40 = 34.92, P < 0.0001) followed by post-hoc Tukey’s test. (D) Effects of local pre-injection of a TRPA1 antagonist AP-18 (50 mM, 0.3 ml) on nociceptive behavior caused by intramuscular injection of H2O2 (100 mM, 0.3 ml). Therefore, the total injection volume was 0.6 ml, and the final concentration was 25 mM for AP-18, and 50 mM for H2O2. Vehicle + SIF group (n=7); Vehicle + H2O2 group (n=7); AP-18 + H2O2 group (n=6). * P < 0.0001 compared with vehicle + SIF injection group, † P = 0.0001 compared with AP-18 + H2O2 injection group by one-way ANOVA (F2, 17 = 25.65, P < 0.0001) followed by post-hoc Tukey’s test. Vehicle + SIF and Vehicle + H2O2 control groups are the same control data presented in Fig. 5B in our previous study.12 (E) Total nociceptive time during the 60-minute period after injection of H2O2 into the gastrocnemius muscle or subcutaneous tissue overlying gastrocnemius muscle in sodium azide-treated rats. Sodium azide (10 mg/kg) was administered intraperitoneally 30 minutes before the injection of H2O2. Each group contained six rats. *, † P < 0.0001 compared with vehicle group by unpaired t-test. All data are expressed as means ± SEM. (F) Total nociceptive time during the 60-minute period after cinnamaldehyde (CM, 30 mM, 0.6 ml) injection into the gastrocnemius muscle (IM CM) or subcutaneous tissue (SQ CM) overlying gastrocnemius muscle in rats. Each group contained seven rats. * P = 0.0129 compared with the SQ CM group, † P = 0.0121 compared with IM vehicle group by one-way ANOVA (F2, 18 = 6.923, P = 0.0059) followed by post-hoc Tukey’s test. All data are expressed as means ± SD.

