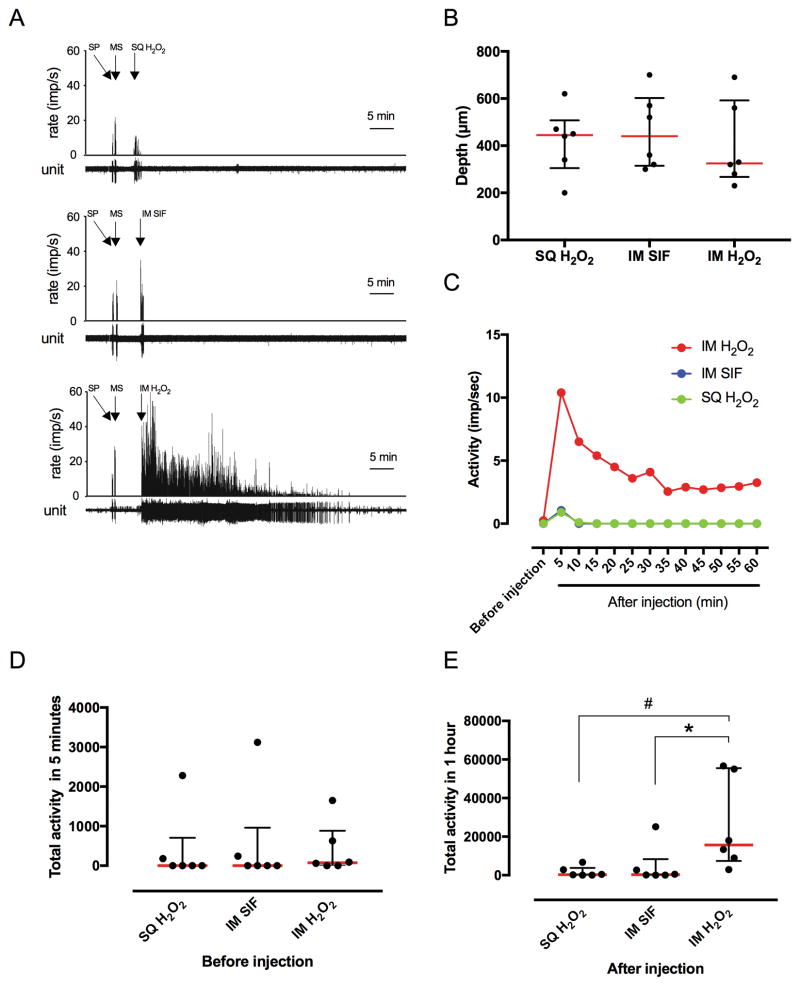
Fig. 4. Effects of intramuscular injection of H2O2 on activity of dorsal horn neurons (DHNs).
(A) Example recordings of neurons after subcutaneous (SQ) injection of H2O2 (upper panel), intramuscular (IM) injection of SIF (middle panel), and IM injection of H2O2 (lower panel). Arrows represent pinching the skin (SP), squeezing gastrocnemius muscle (MS), and the time of injections. Bin width = 1 second. Unit represents each single action potential. (B) The average depth from the surface of spinal cord in which DHNs were recorded in each groups. Data are expressed as median with interquartile range. (C) Time-course trend of changes in activity of the DHNs after injection of H2O2 or vehicle. Data points show the median impulse/second for six neurons in each group in 5-minute bins. (D) Total activity in 5 minutes of the DHNs prior to injection. Data are expressed as median with interquartile range. Each group contained 6 neurons. (E) Total activity of the DHNs during 60 minutes after injection. Data are expressed as median with interquartile range. Each group contained 6 neurons. * P = 0.0482, # P = 0.0261 by Kruskal-Wallis test.

