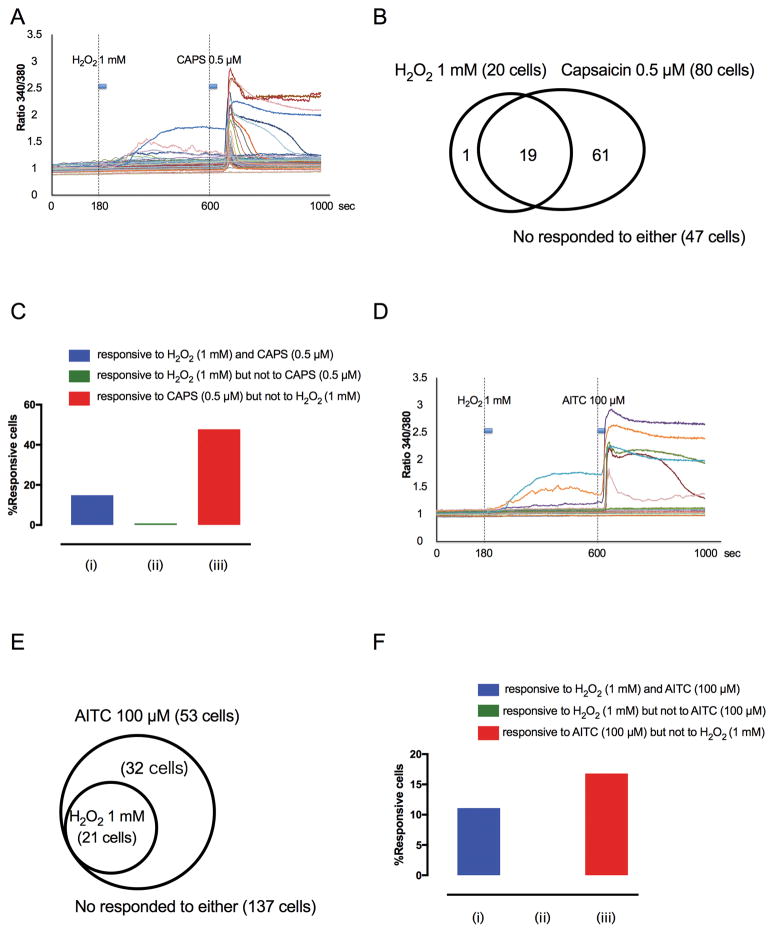
Fig. 6. DRG neuronal responses to H2O2 (1 mM), capsaicin (0.5 μM) and allyl isothiocyanate (AITC; 100 μM).
(A) Example traces of response to H2O2 and capsaicin (CAPS; 20-second application of each) of individual, dissociated lumbar 3–5 DRG neurons during Fura-2 Ca2+ imaging. (B) Venn diagrams illustrating the overlap of cells exhibiting Ca2+ transients in response to H2O2 and capsaicin. (C) Percentage of cells that responded both to H2O2 and capsaicin (blue column), that responded to H2O2 but not to capsaicin green column), and that responded to capsaicin but not to H2O2 (red column). (D) Example traces in response to H2O2 and AITC (20-second duration of each) of individual, dissociated lumbar 3–5 DRG neurons during Fura-2 Ca2+ imaging. (E) Venn diagrams illustrating the overlap of cells exhibiting Ca2+ transients in response to H2O2 and AITC. (F) Percentage of cells that responded to both H2O2 and AITC (blue column), that responded to H2O2 but not to AITC (green column), and that responded to AITC but not to H2O2 (red column).

