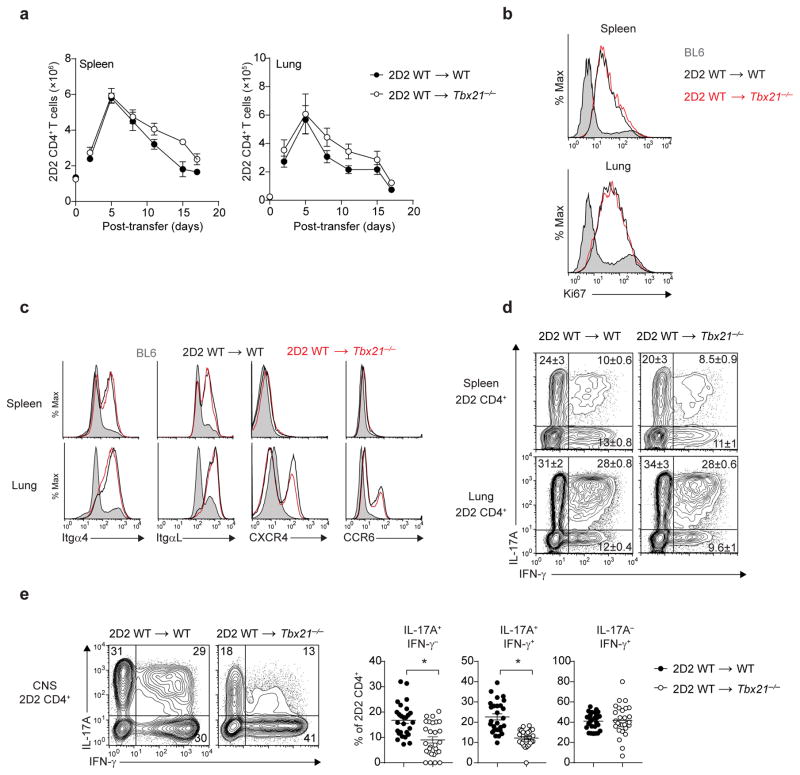
Figure 2.
Peripheral licensing of CD4+ TH17 cells in Tbx21−/− host. (a) Time-course analysis quantifying the number of 2D2 CD4+ T cells (CD4+Vβ11+) in the spleens or lungs of Tbx21−/− or WT mice, following adoptive transfer of 7.5 × 10⁶ 2D2 WT TH17 cells. (b) Ki67 intracellular staining of 2D2 CD4+ T cells (CD3+CD4+Vβ11+) trafficking through the spleens or lungs of Tbx21−/− or WT mice five days post-adoptive transfer (n = 5 mice per group). Histograms are overlaid with Ki67 expression in endogenous WT (BL6) CD4+ T cells (shaded). (c) Expression of migratory receptors on 2D2 CD4+ T cells trafficking through the spleens or lungs of Tbx21−/− or WT mice five days post-adoptive transfer. Histograms are overlaid with expression detected on endogenous WT (BL6) CD4+ T cells (shaded). (d) Intracellular cytokine staining of 2D2 CD4+ T cells from the spleens or lungs of Tbx21−/− or WT mice, five days post-adoptive transfer. (e) Intracellular cytokine staining of 2D2 CD4+ T cells from the CNS of Tbx21−/− or WT mice at the peak of EAE disease (day 15–17 post-transfer). *, P < 0.0001 (two-tailed Student’s t-test). Data are representative of two independent experiments (a,d; mean ± s.e.m. of n = 6 mice per group), three independent experiments (c; n = 10 mice per group) or five independent experiments (e; mean ± s.e.m. of n = 27 mice per group).

