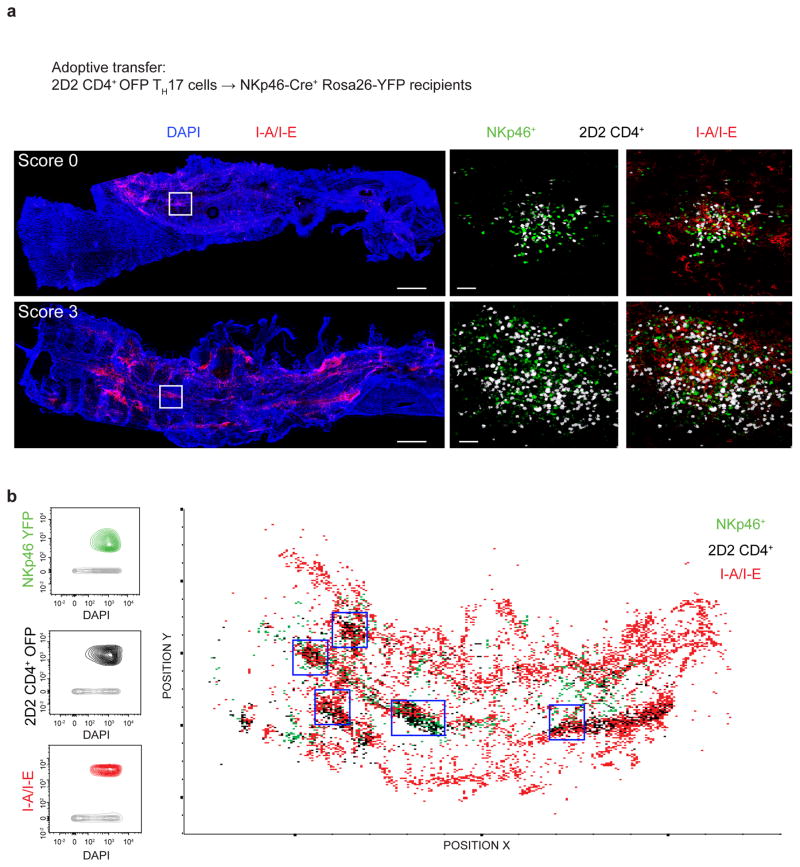
Figure 5.
Localization of T-bet-dependent NKp46+ ILCs during EAE. (a) A total of 7.5 × 10⁶ 2D2 CD4+ OFP+ TH17 cells were adoptively transferred into NKp46+ reporter mice (NKp46-Cre+ Rosa26-loxP-STOP-loxP-YFP). Spinal cord meninges were isolated from NKp46+ reporter mice before the onset of symptoms (score 0) and during the peak of disease (score 3) and stained with DAPI and anti-MHCII (I-A/I-E). Inset images show clusters of NKp46+ (green) and 2D2 CD4+ T cells (white), without (left) and with (right) MHCII (I-A/I-E) staining. Scale bars, 500 mm for main images or 40 μm for insets. (b) Spots statistics from the whole mount shown in (a) (score 3) were exported and plotted for identification of distinct immune subsets. NKp46-YFP+, 2D2 CD4+ OFP and I-A/I-E voxel gating allowed identification and spatial visualization of the NKp46+ ILCs, 2D2 CD4+ T cells and MHCII-expressing APCs, respectively, by histo-cytometry (as described in Methods). Histological analysis is representative of 2 independent experiments (n = 3 mice for score 0 and n = 4 mice for score 3).

