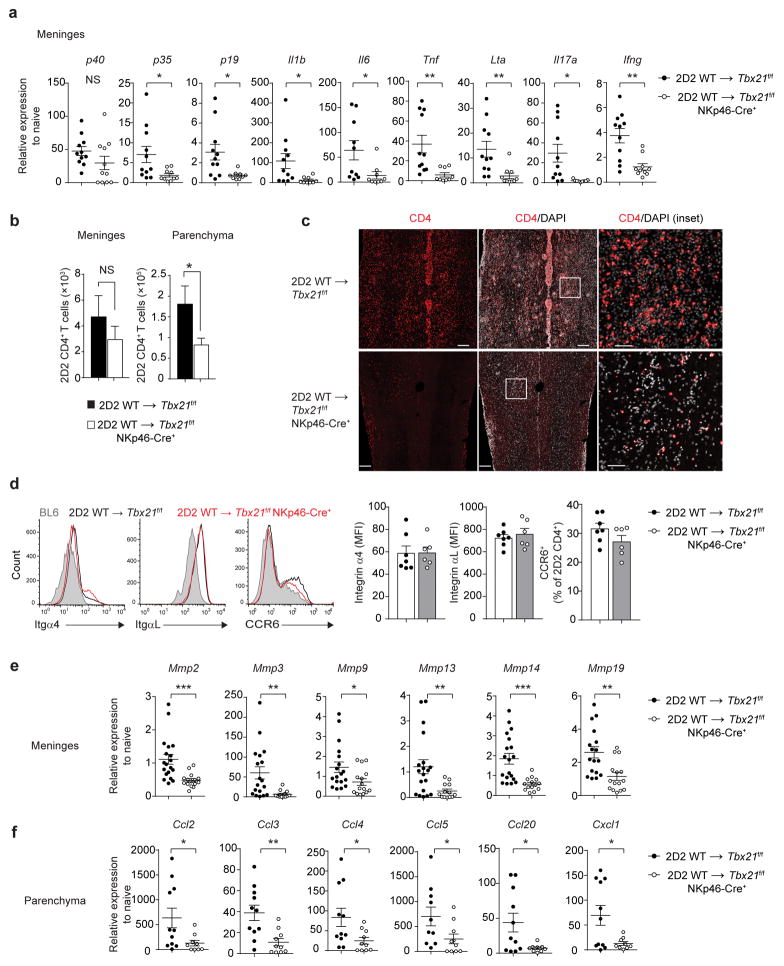
Figure 7.
NKp46+ ILCs regulate infiltration of CD4+ TH17 cells. (a) Quantitative RT-PCR analysis of genes encoding pro-inflammatory cytokines in the spinal cord meninges of Tbx21f/f or Tbx21f/f NKp46-Cre+ mice following the adoptive transfer of 7.5 × 10⁶ 2D2 WT TH17 cells. Gene expression is presented relative to the housekeeping gene Hprt, and normalized to transcript abundance from naïve WT (BL6) mice. (b) Absolute number of 2D2 CD4+ T cells (CD4+Vβ11+) in the spinal cord meninges and CNS parenchyma of Tbx21f/f or Tbx21f/f NKp46-Cre+ mice as quantitated by flow cytometry. (c) Immunohistological analysis of longitudinal spinal cord sections from Tbx21f/f or Tbx21f/f NKp46-Cre+ mice following the adoptive transfer of 2D2 WT TH17 cells. Tissue sections were stained with DAPI and anti-CD4. Scale bars, 200 μm for main images or 50 μm for insets. (d) Expression of integrins α4, αL and CCR6 on CNS-infiltrating 2D2 CD4+ T cells (day 18–20 post-adoptive transfer). Bar graphs depict the average mean fluorescence intensity (MFI) of α4 and αL staining and mean percentage of CCR6+ 2D2 CD4+ T cells. (e–f) Quantitative RT-PCR analysis of genes encoding matrix metalloproteinases (MMPs) in the spinal cord meninges and chemokines in the spinal cord parenchyma of Tbx21f/f or Tbx21f/f NKp46-Cre+ mice (quantified as in a). *, P < 0.05; **, P < 0.01; ***, P < 0.001 (two-tailed Student’s t-test). Data are combined from two independent experiments (a,f; mean ± s.e.m. of n = 11 mice per group, d; n = 6, 7 mice per group), three independent experiments (e; mean ± s.e.m. of n =15, 19 mice per group) or four independent experiments (b; mean ± s.e.m. of 17 mice per group). Histology images are representative of 2 independent experiments (n = 6 mice per group).

