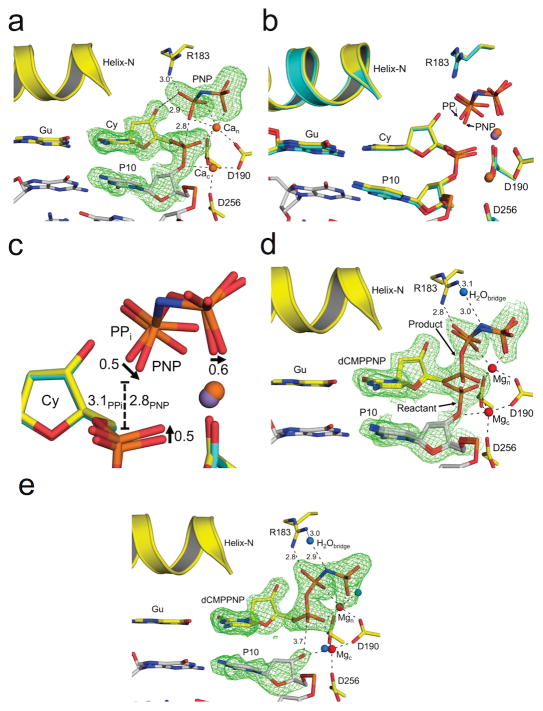
Figure 5. Observing the reverse reaction by time-lapse crystallography.
The pol β active site is shown with key residues indicated; all Fo –Fc omit maps are contoured at 3σ (green). Metal coordination and key distances (Å) are indicated with dashed lines. The carbons of the terminal base pair of the nicked DNA are yellow. The carbons of the upstream DNA are gray. The primer nucleotide upstream of the primer terminus (P10), as well as PNP are indicated. The bridging nitrogen of PNP is colored blue. (a) The active site for the ground state nicked DNA substrate complex with PNP and Ca2+ (orange) is shown. (b) An overlay of the substrate nicked DNA/PNP/Ca2+ complex (yellow carbons) and the nicked DNA/PPi/Mn2+ product complex (PDB code 4KLH; light blue carbons) is shown. The manganese atom from the PPi complex is purple. (c) A close-up of the PPi and PNP phosphate groups from b. The arrows indicate the phosphate oxygen shift for PNP relative to PPi. The distance between the phosphate and the attacking oxygen for PNP and PPi is indicated with a dashed line. (d) The reactant complex for the reverse reaction is shown following a short MgCl2 soak. The Mg2+ and water ions are shown as red and blue spheres, respectively. The distances between the bridging water, Arg183, and the nitrogen of PNP are indicated. The catalytic and nucleotide binding metals are labeled as Mgc and Mgn, respectively. (e) The final one-nucleotide gapped DNA/dCMPPNP ternary complex is shown following the reverse reaction.

