
Figure 2. Monte Carlo Scatter Plots.
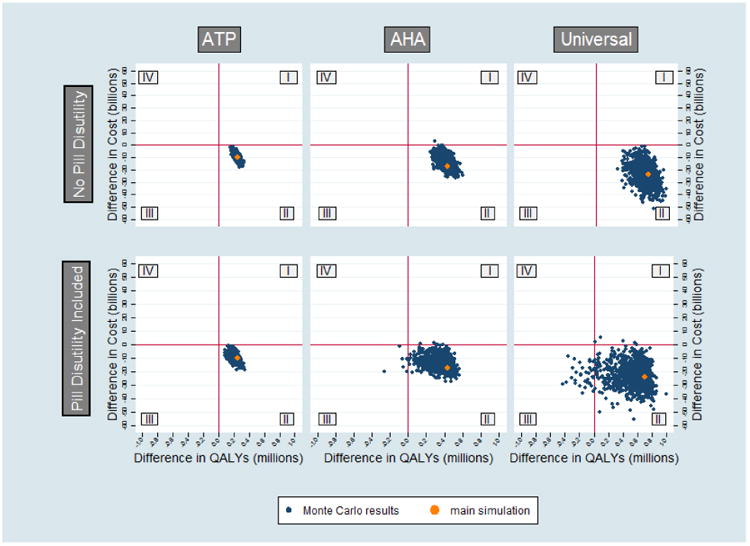
Points to the right of the Y axis (quadrants I and II) represent net benefit, and to the left of the Y axis (quadrants III and IV) represent net harm; points above the X axis (quadrants I and IV) represent a net positive cost, and points below the X axis (quadrants II and III) represent net cost-saving, such that points in the lower right quadrant (quadrant II) constitute net benefit with net cost-saving. Results presuming no pill burden are displayed in the top row and results presuming a nonzero pill burden are in the bottom row.