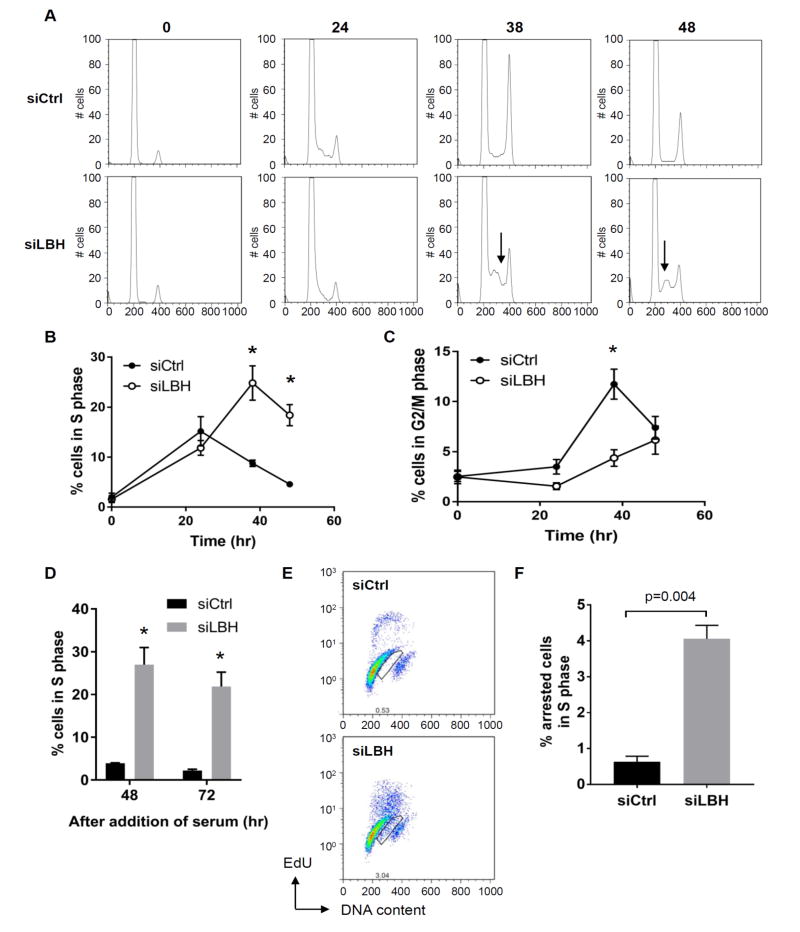
Figure 1. S phase arrest induced by LBH deficiency.
RA FLS were serum starved for 2 days and transfected with siRNA, followed by addition of 10% FBS to release cells into S phase, and at time intervals afterwards, the cells were analyzed. (A) Representative histograms of DNA content in RA FLS lines transfected with siCtrl and siLBH. Arrows show the increased cells in S phase. (B, C) The percentage of cells in S and G2/M phase. Values are averages of 4 different RA FLS lines. (D) The percentage of cells in S phase. Values are averages of 3 different RA FLS lines (E) Representative flow cytometry profiles of control and LBH-knockdown cells. Box regions indicate S-phase arrested cells. (F) Quantification of S phase arrested cells. The average of 4 different RA FLS lines is shown. Values are the mean ± SEM. Data were analyzed using the 2-tailed paired t test.

