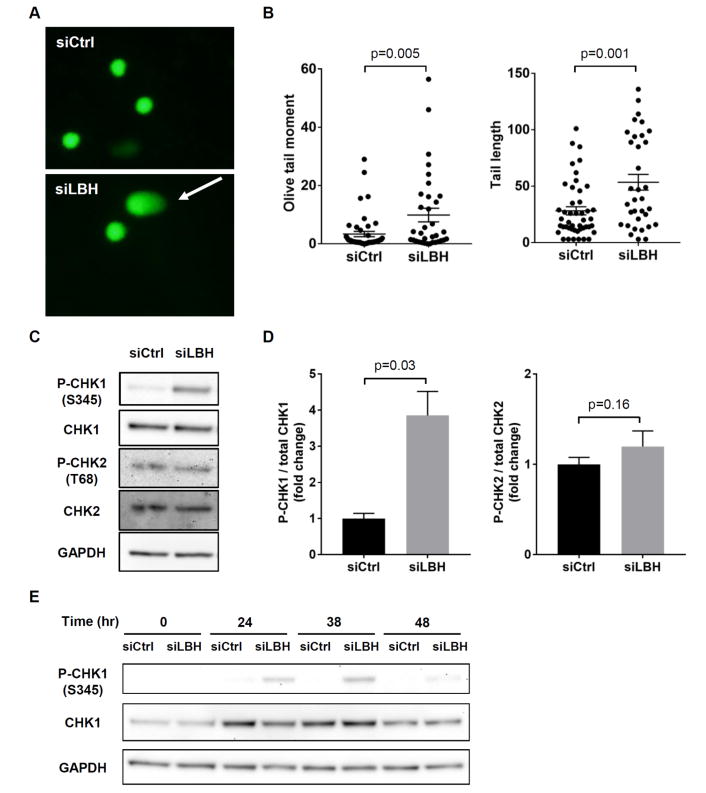
Figure 3. Activation of S phase checkpoint in LBHlow cells.
(A) Representative images of the alkaline comet assay at 48hr after serum addition. The cell looks like a comet with a distinct head consisting of intact DNA, and a tail that contains damaged or broken pieces of DNA shown by arrow. (B) A significant increase was observed in olive tail moment and tail length in LBHlow cells compared with control. Each symbol represents a single subject, and the mean ± SEM are also shown. (C, D) Western blots for CHK1 (S345) and CHK2 (T68) phosphorylation. Bars represent the average of 5 different cell lines. Values are the mean ± SEM. Data were analyzed using the 2-tailed paired t test. (E) Western blots for CHK1 (S345) at the indicated time after serum addition.

