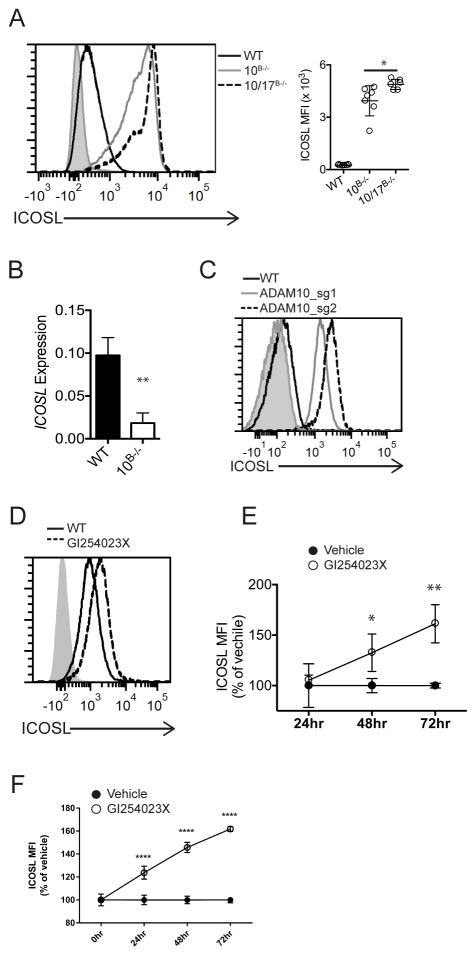
Fig. 1. ADAM10 regulates ICOSL on B cells.
(A) Representative flow analysis of B cells from spleens of naïve WT, ADAM10B−/− and ADAM17B−/− mice and analysis of multiple samples shown at right of A. Isotype control staining is shaded gray. (B) qPCR analysis of Icosl expression from isolated splenic B cells, relative to Hprt. (C) Histogram of ICOSL levels on WT and ADAM10−/− RPMI 8866 cells. Isotype shading in grey. (D) Representative flow histogram of tonsillar IgD+ B cells stimulated with anti-CD40 for 72 hours in the presence of vehicle control or GI543023X. Isotype control staining is shaded gray. (E) Time course analysis of D. ICOSL MFIs were plotted vs. time relative to WT + vehicle control for each timepoint. (F) Splenic WT B cells were stimulated with anti-CD40 for indicated timepoints in the presence of vehicle or 1μM GI254023X, plotted as in E. *P < 0.05, **P < 0.01, ***P < 0.001 One-way ANOVA with Tukey’s post-test (A), Mann-Whitney U test (B), repeated measures ANOVA with Tukey’s post-test (E – F). Data are pooled from three (A–F, mean ± s.d.) independent experiments.

