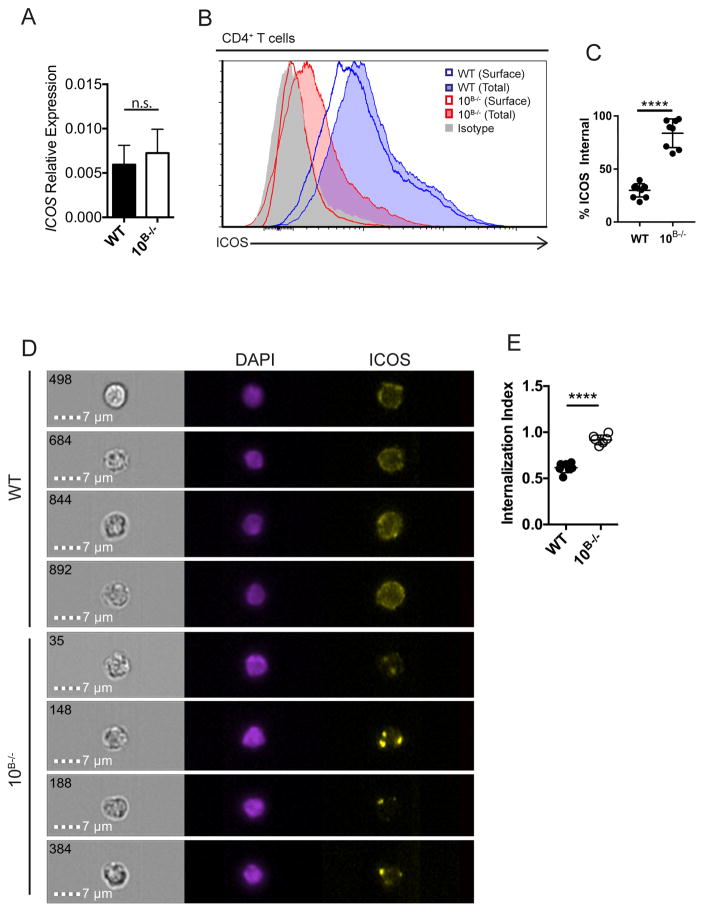
Fig. 4. T cells internalize ICOS in response to elevated ICOSL in ADAM10B−/− mice.
(A) Icos mRNA levels were determined by qPCR on isolated CD4+ T cells from WT and ADAM10B−/− mice. (B, C) CD4+ T cells from WT and ADAM10B−/− mice were analyzed for surface (WT – blue line, ADAM10B−/− - red line) and total (surface + internal; WT – shaded blue, ADAM10B−/− - shaded red) ICOS levels by flow cytometry. Isotype control staining shaded gray. (C) % internal ICOS is represented as a % ICOSInternal = (ICOSTotal-ICOSSurface)/ICOSTotal. (D) Representative images of splenic CD4+ T cells analyzed by ImageStream. (E) Internalization index was determined by internalization of ICOS into the nuclear plane (DAPI) as calculated by Amnis IDEAS software. n.s., not significant (P ≥ 0.05), *P < 0.05, ****P < 0.0001 Mann-Whitney U test (A) and unpaired Student’s t-test (C, E). Data are pooled from two (A – E, mean ± s.d.) independent experiments.

