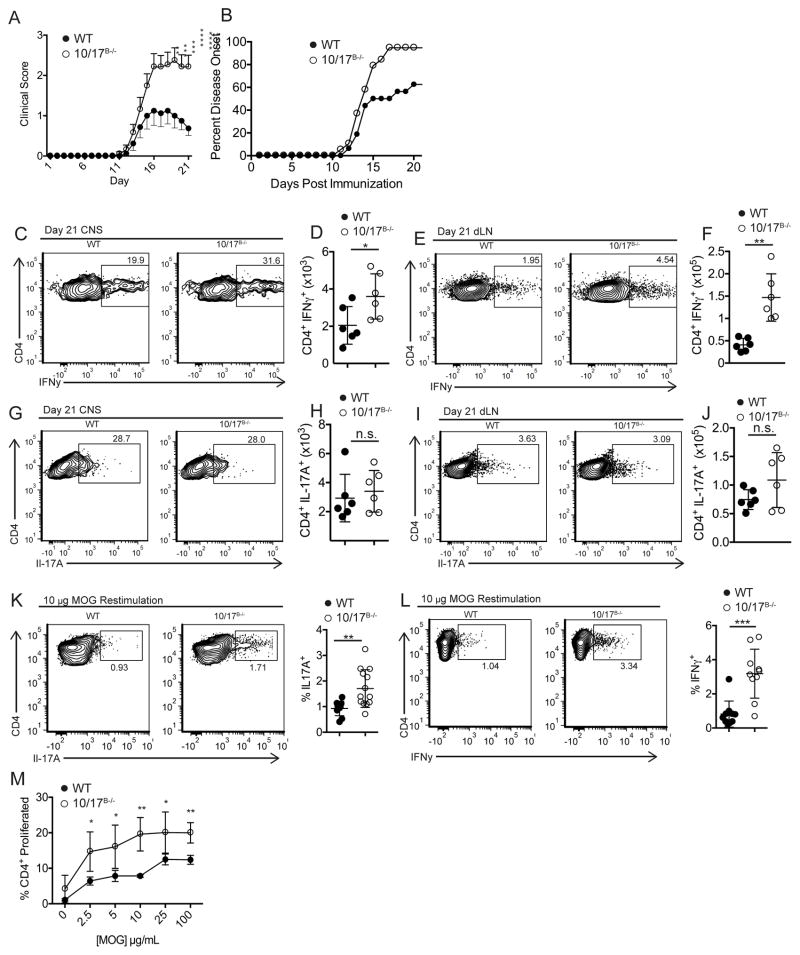
Fig. 7. ADAM10/17 B−/− mice have enhanced TH1 and TH17 responses.
(A, B) WT and ADAM10/17B−/− mice had EAE induced using 200μg MOG35-55. Clinical scores (A) and symptom incidence (B) were measured. (C, D, J, K) CNS tissue was analyzed at day 21 for CD4+ IFNg+ T cells (C, D) and CD4+ IL-17A+ T cells (J, K). (E, F, L, M) dLNs were analyzed at day 21 for CD4+ IFNg+ T cells (E, F) and CD4+ IL-17A+ T cells (L, M). (N, O) cells from day 21 dLN of EAE induced mice were restimulated with 10μg of MOG35-55 for 3 days and IL-17A (N) and IFNγ (O) expression was measured by flow cytometry. (P) Cells from day 21 dLN of EAE mice were isolated and restimulated with varying concentrations of MOG35-55 for 4 days in vitro and proliferation was measured using cell trace violet. n.s., not significant (P ≥ 0.05). *P < 0.05, **P < 0.01, ***P < 0.001, ****P < 0.0001. Two-way ANOVA with Tukey’s post-test (P), repeated measures ANOVA (A, B), or unpaired Student’s t-test (D, K, F, M, N, O). Data are pooled from three (A–P) independent experiments.

