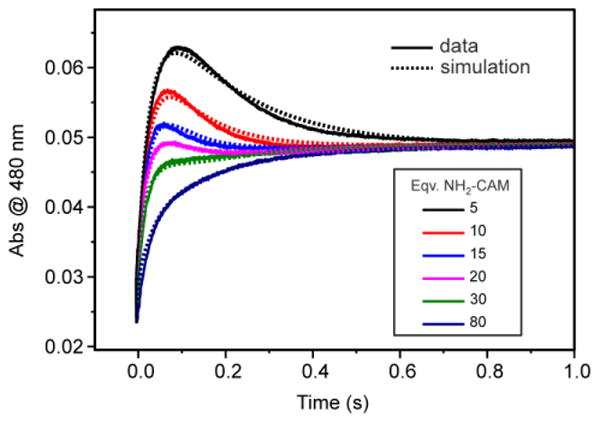
Figure 11.

NH2-CAM concentration dependence of the overall reaction time course. The solid curves are for optical changes at 480 nm from the reaction of CmlIred (200 μM) with 1-16 mM NH2-CAM (final, postmix concentrations) in O2-saturated buffer and the dashed curves are for simulation of the same reaction using numerical integration. The rate constants and reactions used for the simulation are shown in Scheme 4 (see Discussion). The postmix O2 concentration is ∼ 0.9 mM at 4 °C. (50 mM Bicine at pH 9 and 4 °C).
