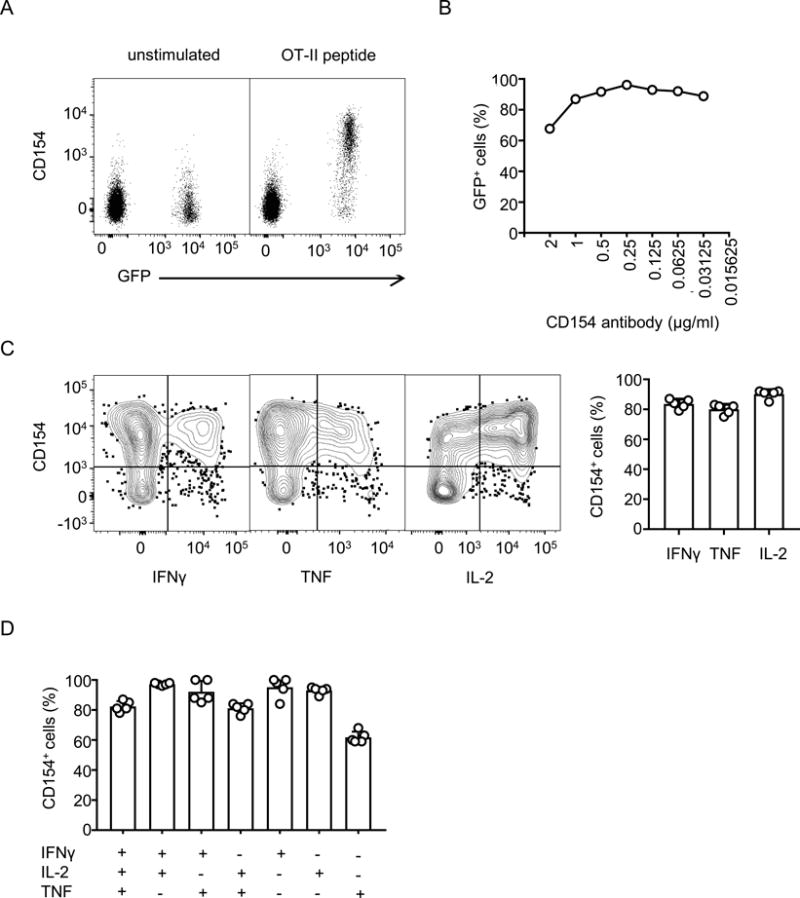
Figure 1. Expression of CD154 on adoptively transferred OT-II transgenic CD4+ T cells.

A) Mice were vaccinated with ovalbumin and poly (I:C) one day after adoptive transfer of GFP+ OT-II transgenic CD4+ T cells. On the 7th day after vaccination, splenocytes were isolated and stimulated for 6 hours with ovalbumin peptide in the presence of PE-conjugated anti-CD154 antibody and monensin. Flow cytometry analysis was performed after staining for additional surface markers (anti-CD8α, -B220 and -MHCII) and with viability dye for exclusion of dead cells. The cells shown are singlet events from the lymphocyte gate that are positive for CD4 and negative for Live/Dead stain, CD8α, B220 and MHC-II. Dot plots show levels of CD154 on adoptively transferred OT-II transgenic CD4+ T cells (GFP+) and recipient CD4+ T cells (GFP−) with and without re-stimulation. B) Percentage of GFP+ cells among CD154+ cells when varying concentrations of anti-CD154 antibody were included in the re-stimulation medium. C) Splenocytes, surface-stained for CD154 and other markers as in panel A, were fixed, permeabilized and stained for intra-cellular cytokines. Only GFP+ OT-II CD4+ T cells are shown. The bar chart on right summarizes the percentages of CD154+ cells among total cytokine producing cells. D). Experiments were performed as in Panel C. Cytokine-producing cells were grouped into single, double and triple cytokine-producers using boolean gating strategy and analyzed for the co-expression of CD154. The percentages of cells that co-express CD154 are shown for each group. Results shown represent two independent experiments.
