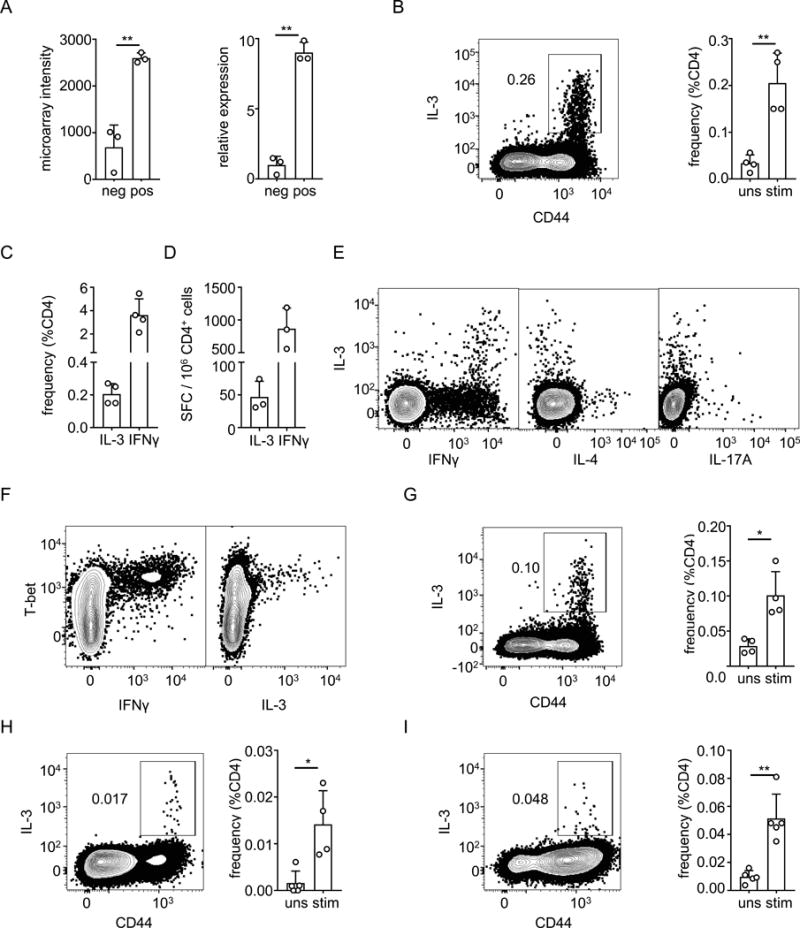
Figure 5. Induction of IL-3 producing CD4+ T cells by mycobacteria.

A) Analysis of IL-3 expression at RNA level of CD154− (neg) and CD154+ (pos) CD4+ T cells sorted from spleens of BCG-vaccinated mice. Graph on left shows normalized microarray intensity of IL-3 transcripts, and graph on right shows quantitative PCR analysis of IL-3 transcripts. B) Splenocytes from BCG-vaccinated mice were stimulated with Mtb lysate for 6 hours. Cells were stained with antibodies for surface markers including CD44, fixed and intracellular cytokine staining for IL-3 was performed. The cells shown are single cells from the lymphocyte gate that were positive for CD4 and negative for Live/Dead stain, CD8α, B220 and MHC-II. Barplot on the right summarizes the frequencies of IL-3 producing CD4+ T cells either without stimulation (uns) or with stimulation (stim). C, D). Mice were vaccinated with BCG and stimulated as in Panel B, and the frequencies of IL-3 producing and IFNγ producing CD4+ T cells in spleens were determined by intracellular cytokine staining (C) or by ELISPOT (D). SFC, spot forming cells. E) Analysis of splenocytes from BCG-vaccinated mice performed as in panel B, using intracellular cytokine staining to show co-expression of IL-3 with IFNγ, IL-4 and IL-17A. F). Intracellular staining of splenocytes prepared as in panel B and stained for T-bet in addition to IL-3 and IFNγ. G). Splenocytes from mice were infected with M. smegmatis, re-stimulated for 6 hours in vitro with lysate of M. smegmatis, and then stained and analyzed as in (B). H, I). Mice were infected with M. tuberculosis by aerosol route and four weeks later, single cell suspensions made from mediastinal lymph nodes (H) or lungs (I) were re-stimulaed with ESAT-6 peptide in the presence of brefeldin A and monensin. The cells were then surface stained, fixed, permeabilized and stained for intracellular IL-3. The cells shown are single cells from the lymphocyte gate that were positive for CD4 and negative for Live/Dead stain, CD8α, B220 and MHC-II. Barplot on the right summarizes the frequencies of IL-3 producing CD4+ T cells either without stimulation (uns) or with stimulation (stim). Bars in all plots show mean values for 3-4 replicates, open circles show values for individual mice, and error bars show 1 SD. * p < 0.05; ** p < 0.005 for Student’s t-tests. Results shown are representative of two independent experiments.
