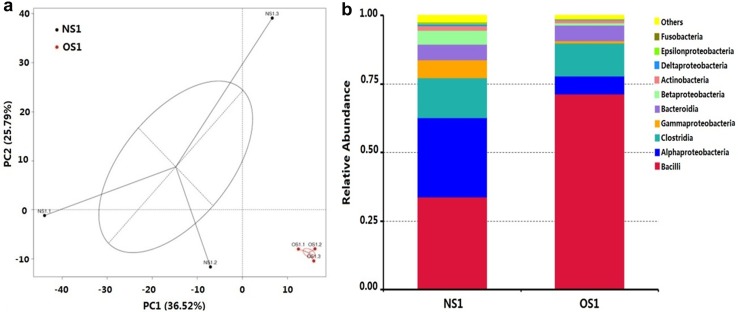
Fig. 3.
Statistical analyses of microbial communities between different samples. a Cluster analyses based on principal component analysis (PCA) using weighted UniFrac. b Relative abundances of different classes in the two types of APMs. Presented taxa are the top ten classes. NS1 high-quality APM, including samples NS1.1, NS1.2, and NS1.3; OS1 aging low-quality APM, including samples OS1.1, OS1.2, and OS1.3

