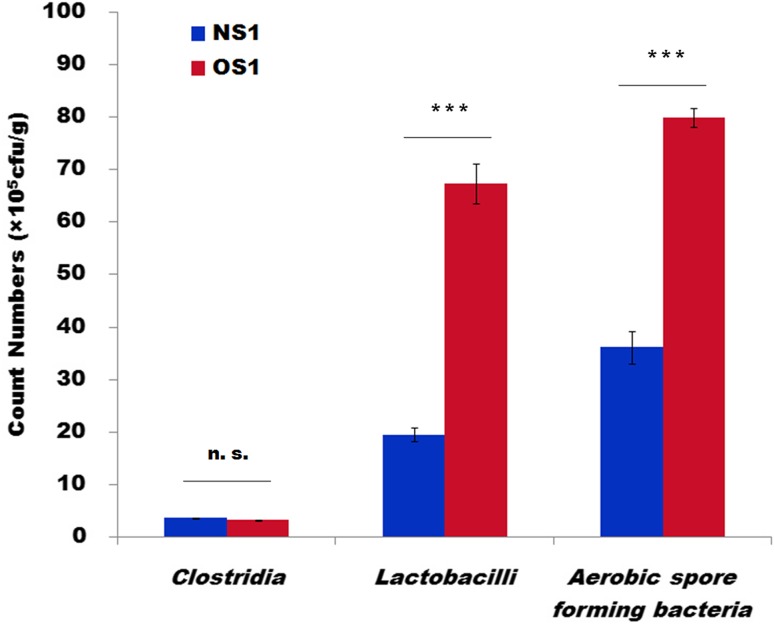
Fig. 4.
Colony number of three representative bacterial groups cultivated on different selective agar plates. NS1 high-quality APM, including samples NS1.1, NS1.2, and NS1.3; OS1 aging low-quality APM, including samples OS1.1, OS1.2, and OS1.3. All data are presented as mean ± standard deviations (n = 3). Significance was determined by ANOVA (P < 0.05). ***P < 0.01; n. s. nonsignificant

