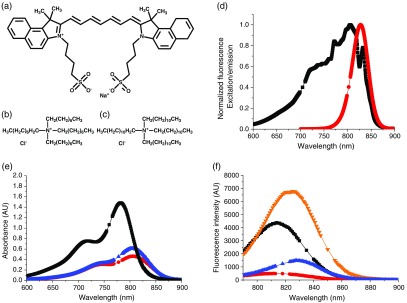
Fig. 1.
(a) Structure of ICG, (b) structure of TOAC, (c) structure of TDDAC, (d) normalized FL excitation and emission spectra for ICG in DMSO (▪ excitation, • emission). Excitation wavelength used was 772 nm, whereas the emission peak varied between 810 and 831 nm depending on whether the ICG was free in solution or NC-encapsulated. (e) and (f) Absorbance and FL spectra of ICG formulations at (▪ free ICG in water, ▾ ICG + 4 wt. % BSA in phosphate buffer, • in situ complex at 10 wt. % loading in PS-b-PEG micelles, ▴ in situ complex at 10 wt. % loading in VE + PS-b-PEG NCs). Absorbance curves in (e) and lower in magnitude and red-shifted relative to the free ICG curve indicating the formation of aggregates within the NC core. FL curves in (f) show the brightness of ICG increases almost twofold upon incubation with BSA (comparable to physiological protein levels) but decreases significantly upon complexation and encapsulation within block copolymer micelles or NCs with VE cores. Gaps in data to show symbols clearly.

