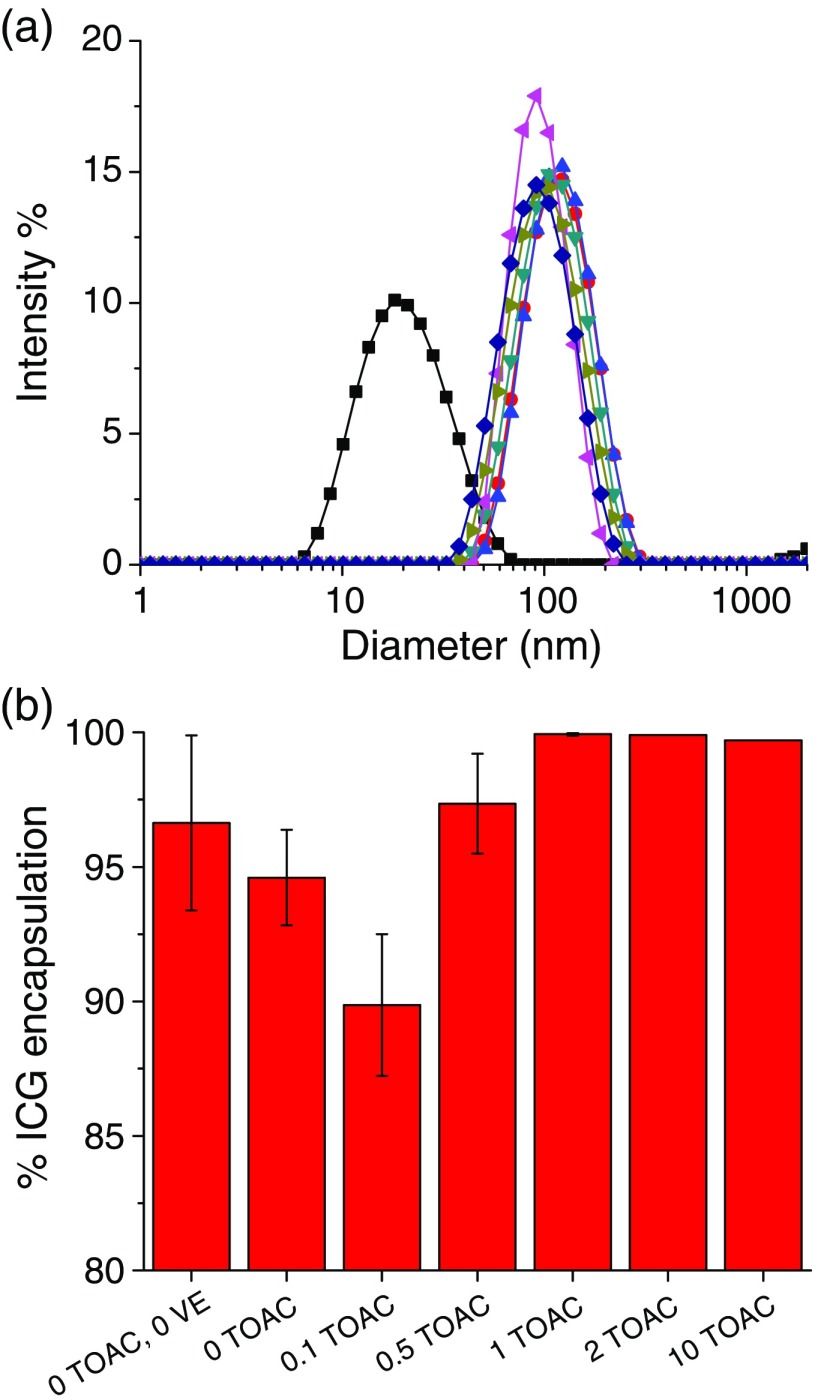
Fig. 5.
ICG encapsulation efficiencies as a function of TOAC:ICG ratio (in situ complex formation): (a) size distributions of particles (▪ micelles (0 TOAC, 0 VE),• 0 TOAC, ▴ , ▾ , ◂ , ▸ , ♦ ) and (b) the ratio of TOAC to ICG was varied from 0 to for in situ ICG NC precipitation. The number of TOAC equivalents relative to ICG is labeled on the abscissa.

