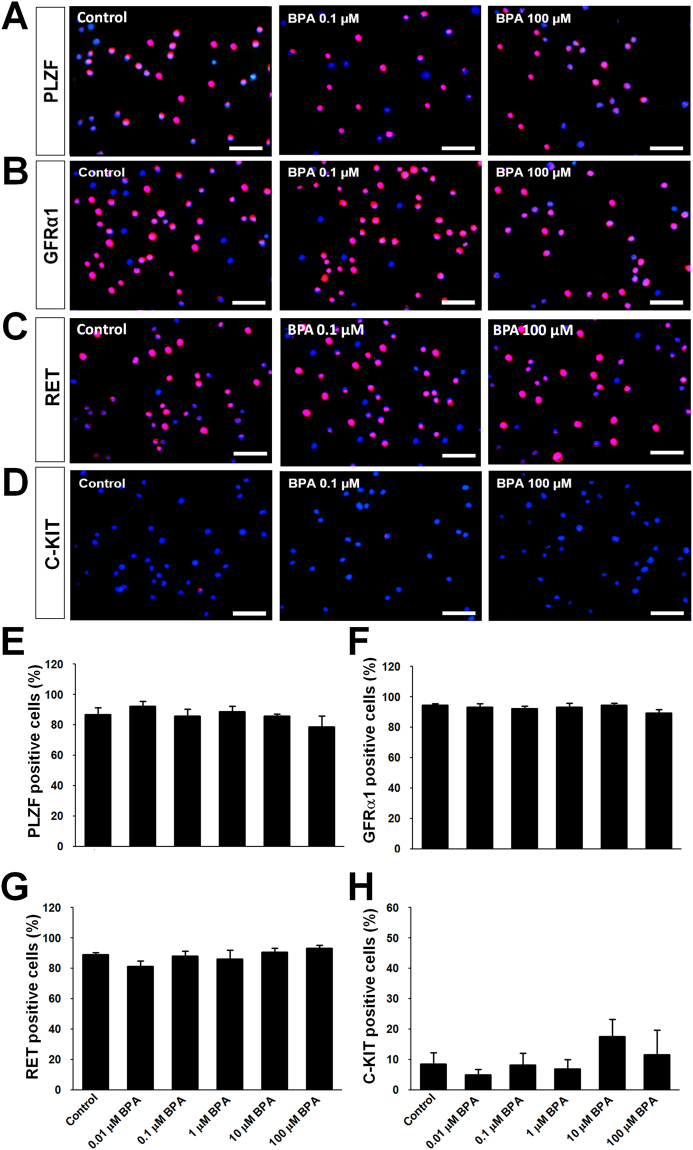
Figure 3.
Spermatogonia related marker proteins’ expression in bisphenol A (BPA)-treated cultured germ cells enriched for spermatogonial stem cells. Immunostaining of undifferentiated spermatogonia markers’ expression in 1 week BPA-administrated cultured germ cells are indicated as red fluorescence, (A) PLZF, (B) GFRα1 and (C) RET. Pictures of low BPA treatment (0.1 µM BPA) and high BPA treatment (100 µM BPA) are given because the expression patterns of all treatment groups are visually similar. (E, F, and G) The percentage of these markers’ expression among total cells showed sequentially as bar graph. (D) The expression of differentiated spermatogonia specific marker C-KIT in 1 week BPA-administrated cultured germ cells (red). (H) Bar graph presentation of the percentage of C-KIT positive cells. Data were obtained from 6 independently established cultures with different BPA treatments. Cells were counterstained with DAPI (blue). Scale bars = 50 μm.

