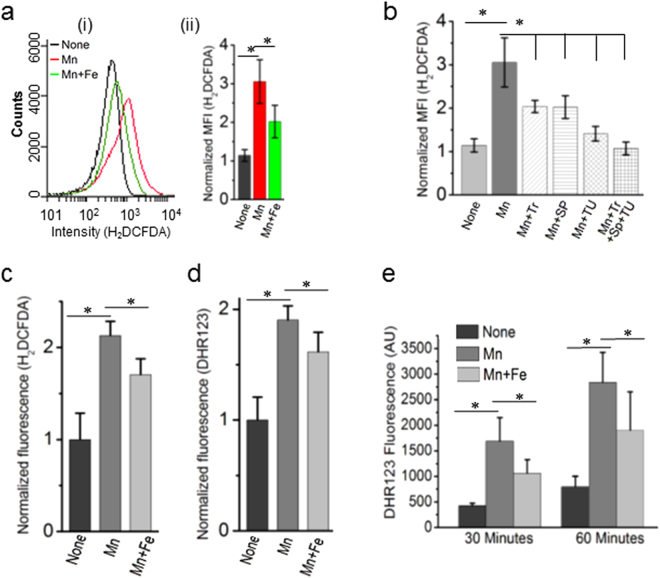
Figure 3.
Manganese stress evokes ROS production. (a) (i) The FACS data shows the changes in fluorescence intensity of H2DCFDA, an indicator dye of oxidative stress, under manganese stress and iron supplementation. Fluorescence intensity is directly proportional to the amount of ROS species in the cell. (ii) Normalized MFI values from three independent experiments are shown by bar diagrams. (b) The normalized MFI values of H2DCFDA dye under manganese stress and in the presence of ROS quenchers (Tr: tiron, SP: sodium pyruvate, TU: thiourea). (c) The H2DCFDA fluorescence values were normalized by intracellular dye contents to show that manganese stress evokes ROS production. (d) To validate H2DCFDA fluorescence results, another dye DHR123 has been used. Increased intracellular dye-normalized fluorescence values of DHR suggests that manganese-fed cells evoke ROS. (e) The fluorescence values of DHR123 in the bar diagram indicates that manganese-fed cells produces elevated level of H2O2 in comparison to the un-fed cells at 30 minutes and 60 minutes time points. Iron-supplemented cells marginally suppressed H2O2 production. Data are means ± SD (n = 3); *P < 0.001, paired T-test.

