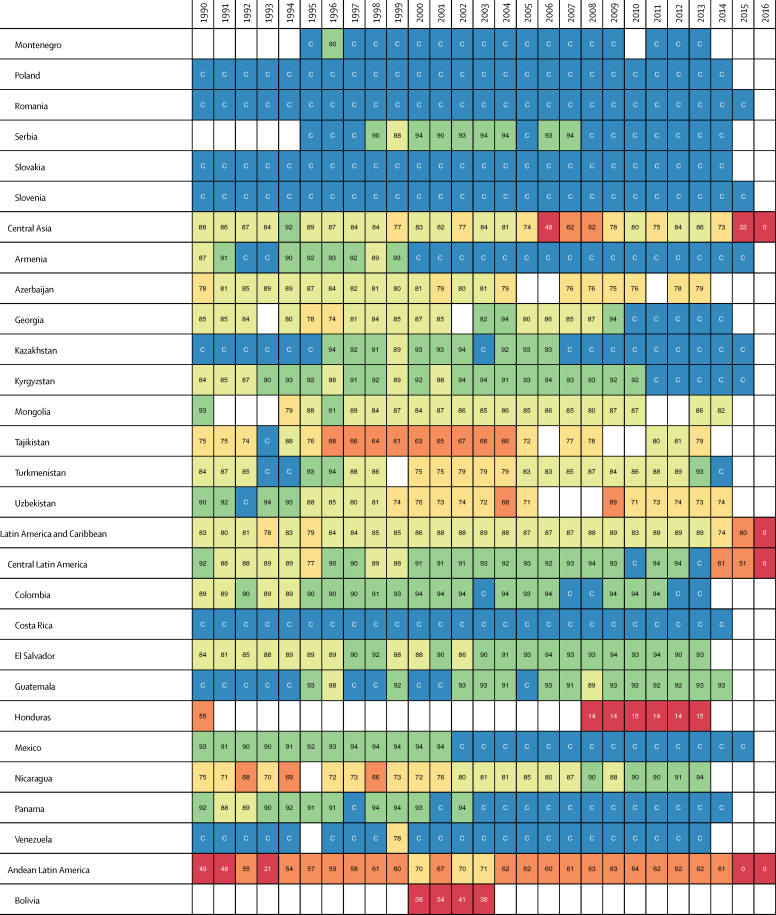
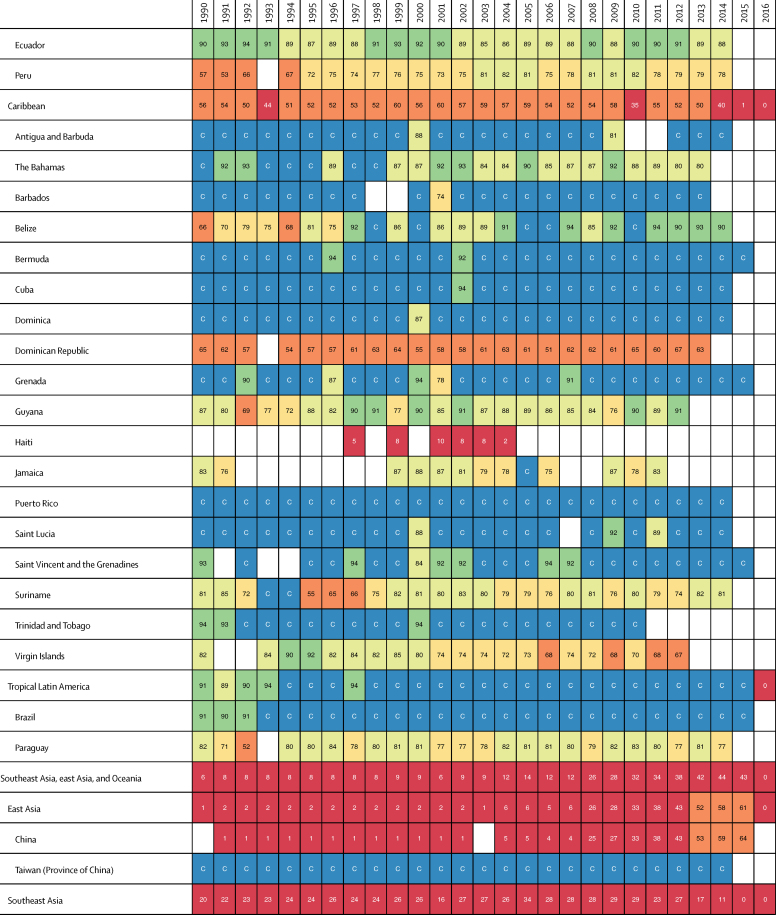
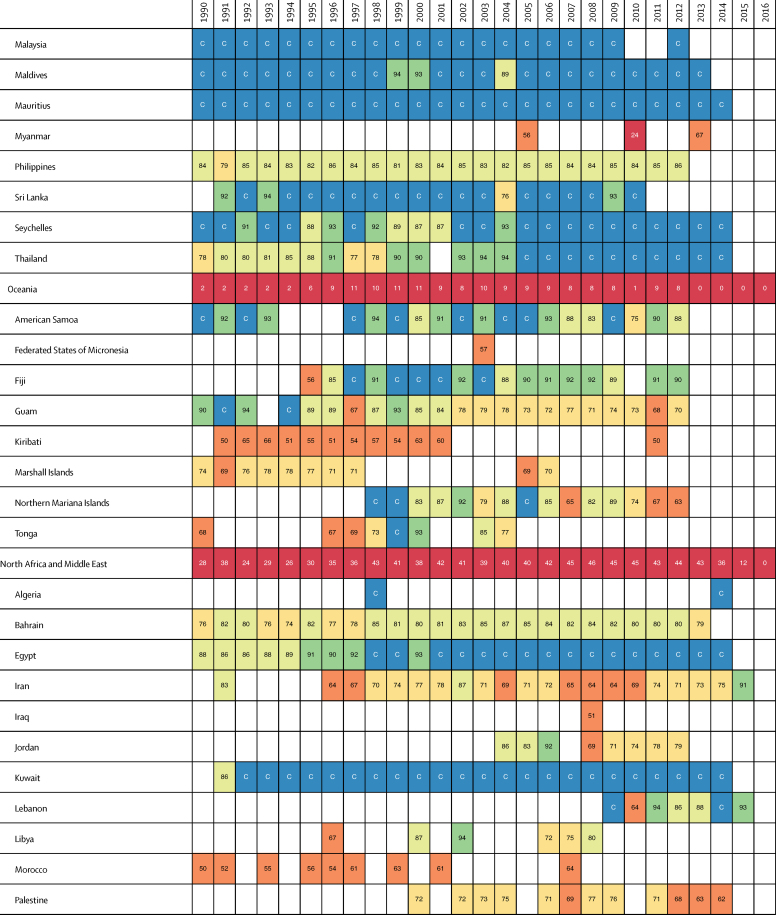
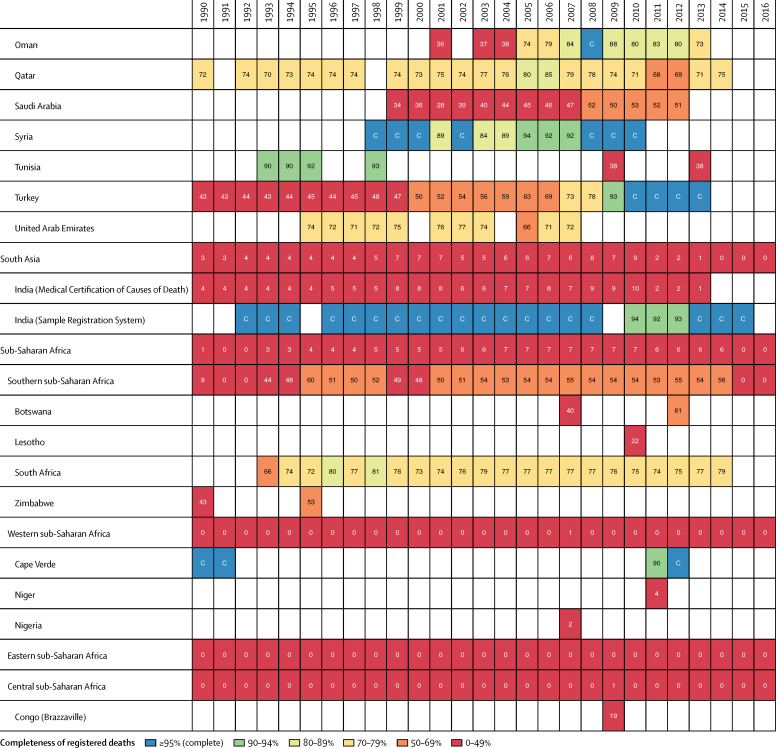
Figure 1.
Estimated completeness of death registration, 1990–2016.
Each square represents one location-year. Location-years in blue show complete vital registration systems. Shades of green show 80–95% completeness, whereas yellow, orange, and red show lower levels of completeness. Blank white squares indicate location-years without vital registration data in the GBD 2016 mortality database. Countries that are not shown have 0 years of VR data in the GBD 2016 mortality database.


