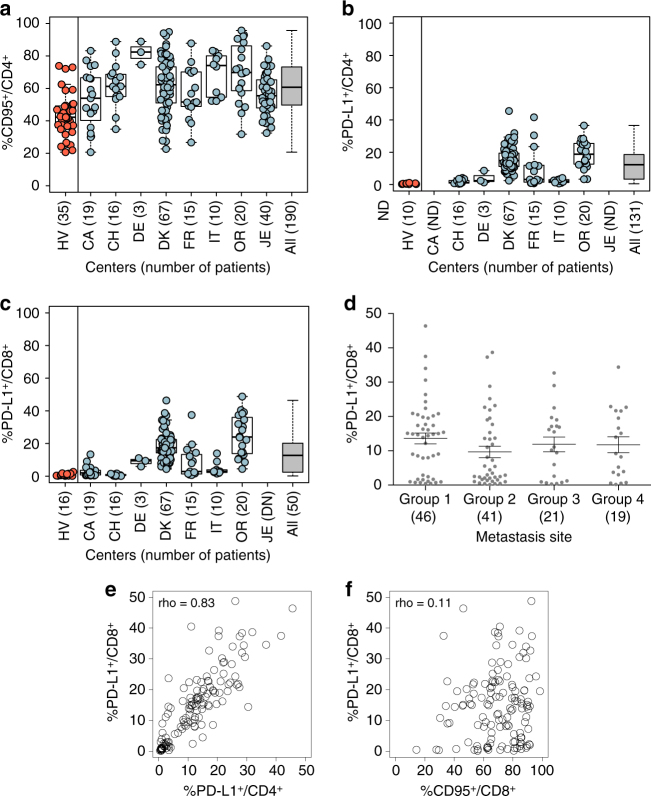
Fig. 4.
Melanoma patients express higher levels of PD-L1 on circulating T cells than healthy volunteers. a−c Percentages of CD95 a and/or PD-L1+ b, c cells among blood CD4+ a, b or CD8+ c T cells, respectively, at baseline prior to ipilimumab. Flow cytometric assessments of the proportions of blood CD3+CD4+ or CD8+ cells expressing PD-L1 after thawing in eight cohorts of MMel (right columns) except CA and/or JE (not assessed), as well as 10–35 healthy volunteers (in red, left column). Each dot represents one healthy volunteer or patient. Mean and s.e.m. are represented along with the box plots for each cohort described in Supplementary Table 2. d Expression of PD-L1 on CD8+ T cells according to the metastatic sites: 1 (skin, lymph node and lung metastases only), 2 (visceral metastases, soft tissues +/− group 1), 3 (bone metastases and+/− groups 1 and/or 2) and 4 (brain metastases and others). e, f Spearman correlation between PD-L1+/CD8+ and PD-L1+/CD4+ or CD95+/CD8+ with rho index; each dot representing one patient. Box and whiskers plots are represented from the corresponding distribution a−c. Mean + s.e.m. d

