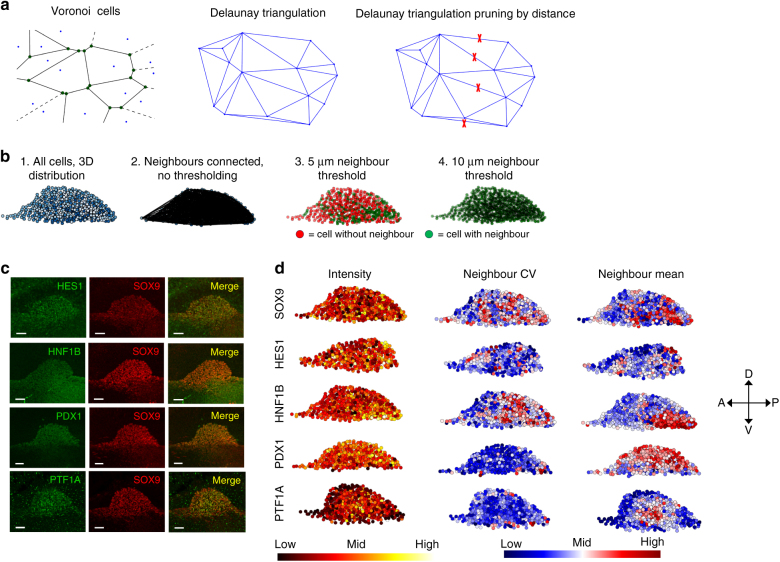
Fig. 3.
E9.5 pancreatic progenitors display heterogeneous expression of pancreas-associated transcription factors and distinct patterns of neighbour cell expression correlation. a Schematic of Voronoi-Delaunay triangulation implemented to identify neighbour cells in 3D. Distance-based pruning was implemented in order to identify biologically meaningful neighbours in 3D space. b Example of Voronoi-Delaunay triangulation-mediated neighbour identification in E9.5 pancreatic bud. Cells colour-coded according to z-position (1) are subjected to Voronoi-Delaunay triangulation, identifying all neighbour relations in 3D (2). Implementation of a distance threshold of 5 μm (3) or 10 μm (4) generates different number of cells with and without 3D neighbours (green and red cells, respectively). For all downstream analyses, 10 μm was chosen as neighbour distance threshold. c Example of transcription factor expression pattern in E9.5 pancreatic buds following whole-mount staining. 3D MIP is displayed. Scale bars, 30 µm. d 3D plots of staining intensity, neighbour coefficient of variation and neighbour mean intensities from immunostaining against the indicated transcription factors. Note the heterogeneous expression patterns of HES1, SOX9 and PTF1A and the regionalised expression of HNF1B (posterior) and PTF1A (lateral) (n = 2 for all, except n = 8 for SOX9. The images displayed show representative data from those)

