Fig. 7.

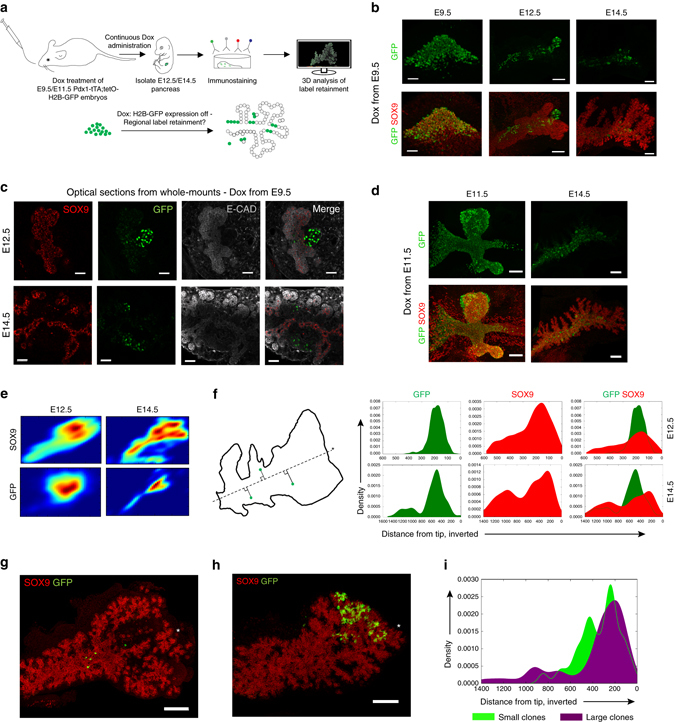
The pancreatic epithelium displays regional differential proliferation explaining impacting clone size. a Schematic overview of strategy implemented to identify spatial differences in proliferative capacities. E9.5 oral gavage and subsequent continuous administration of doxycycline (Dox) prevents expression of H2B-GFP in Pdx1;− tTA/;tetO-H2B-GFP embryos, enabling proliferation-induced label dilution in pancreatic progenitors. b 3D MIP of whole-mount immunostainings of dorsal pancreata at various stages following Dox administration at E9.5. Note the gradual decrease in GFP signal in SOX9+ cells and the presence of strongly label-retaining endocrine clusters and low-retaining central progenitors, as well as the absence of label retention in the distal epithelium and in lateral branches by E14.5 (n = 3 at E9.5 and n = 4 each at E12.5 and E14.5). Representative images were extracted from those. Scale bars, 30 µm (E9.5), 80 µm (E12.5) and 150 µm (E14.5). c Optical sections of E12.5 (top) and E14.5 (bottom) dorsal pancreata following Dox administration at E9.5. E-CADLow endocrine clusters display strong label retention, whereas label-dilution is more pronounced in the proliferative SOX9+ progenitors. Distal lateral branches at E14.5 display complete absence of H2B-GFP retention. Scale bars, 50 µm (E12.5) and 30 µm (E14.5). d Following E11.5 Dox administration, the central portions of the E14.5 pancreas retains H2B-GFP signal, whereas lateral branches exhibit label dilution (n = 3 at E11.5 and n = 1 at E14.5, from which representative images were extracted). Scale bars, 70 µm (E11.5) and 150 µm (E14.5). e Kernel density estimation of SOX9+ progenitors and the density of the top 10% highest GFP-retaining SOX9+ cells. Note the central location of GFP-retaining cells. f One-dimensional projection of SOX9+ progenitors and the top 10% of GFP-retaining cells onto a diagonal line running along the length axis of the dorsal pancreas demonstrate enrichment of GFP-signal in distinct domains of the pancreatic epithelium. g, h 3D MIP showing the spatial distribution of clonal progeny in a small clone in the central, proximal epithelium and a large distal clone, respectively. Scale bars, 150 µm. i Comparison of spatial distribution of smallest and the half of largest clones from Hnf1b CreER -mediated E9.5-E14.5 clonal analysis (n = 12 clones in total)
