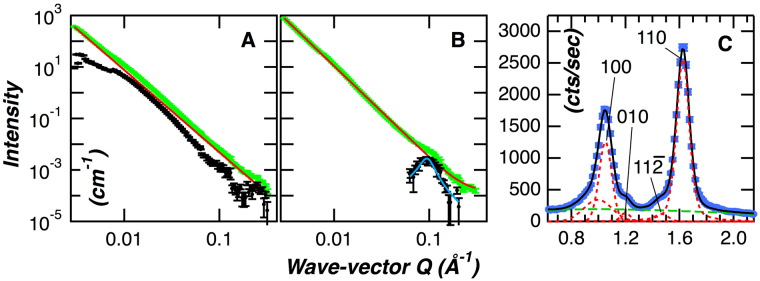
Figure 1.
Analysis of the structure and morphology of dry and hydrated bacterial cellulose. Panel A. SANS profile of dry bacterial cellulose. The experimental SANS data is shown as green square symbols, the power-law fit is shown as a solid red line, deviation from the power-law behavior, evident after subtraction of the underlying power-law is shown as black filled circles. Panel B. SANS profiles of hydrated bacterial cellulose. The color scheme of the curves is the same as panel A. Panel C. Powder X-ray diffraction pattern of bacterial cellulose hydrated in H2O. Experimental data is shown as blue square symbols, green dashed line is the background, and the red dashed lines show the peak positions obtained from data fitting as described in the Materials and Methods section.

