Figure 4.
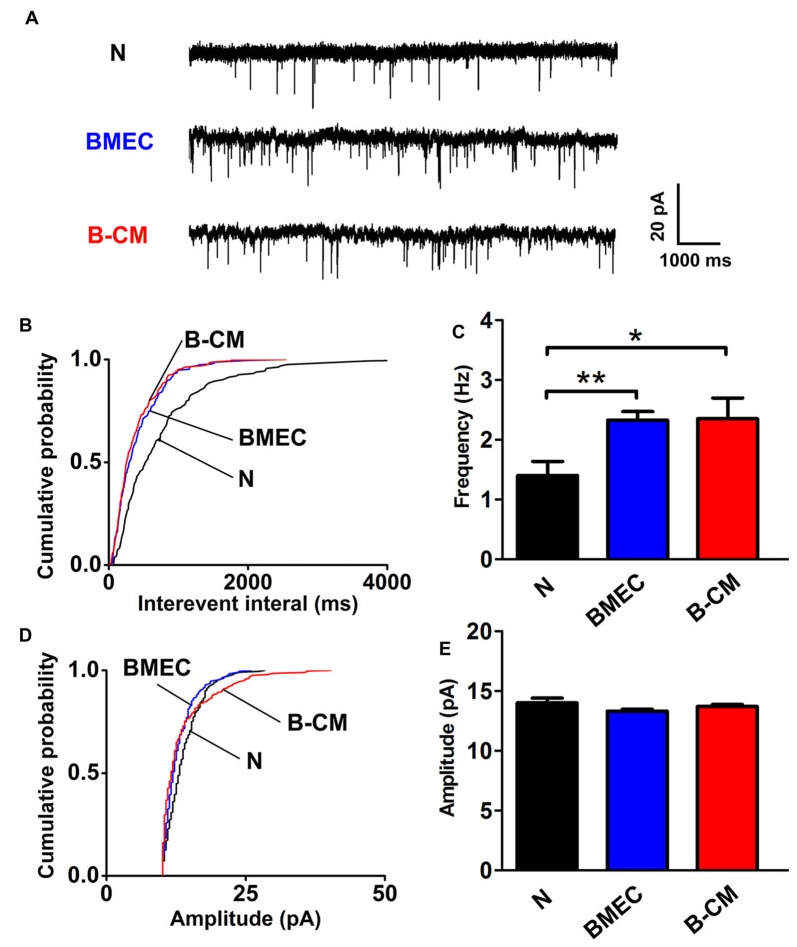
BMEC increase miniature excitatory postsynaptic currents (mEPSC) frequency. (A) Example traces from neurons cultured alone, co-cultured with BMEC or treated with B-CM showing mEPSC recorded in the presence of 1 μM TTX and 10 μM picrotoxin at −65 mV. Scale bar is shown in the right. (B,C) Cumulative probability plots of interevent interval and the quantification of mEPSC frequency are shown. (D,E) Cumulative probability plot of mEPSC amplitude and the quantification of mEPSC amplitude are shown (n = 13 per condition. *p < 0.05; **p < 0.01).

