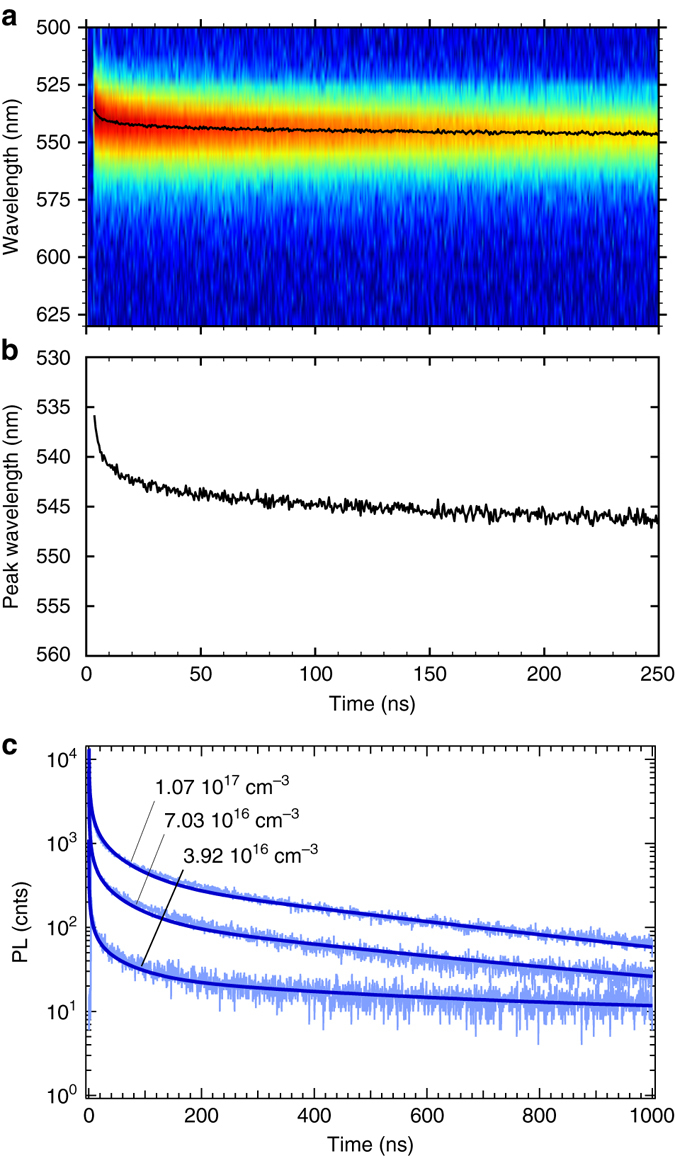
Fig. 5.

Time-resolved photoluminescence spectra of CH3NH3PbBr3 single crystals. a 2D spectral map, b shift of the peak centre position with time. c Numerical evaluation of Eq. (2) for three decays extracted from Supplementary Fig. 7. The initial carrier densities are indicated on the Figure. Parameters: µ n = 10 cm2 V−1 s−1, µ p = 50 cm2 V−1 s−1, k 2 = 1×10⁻¹⁰ cm3 s−1, k 1,n = 9×10⁵ s−1, k 1,p = 1×10³ s−1. See details of simulation in the Supplementary Discussion
