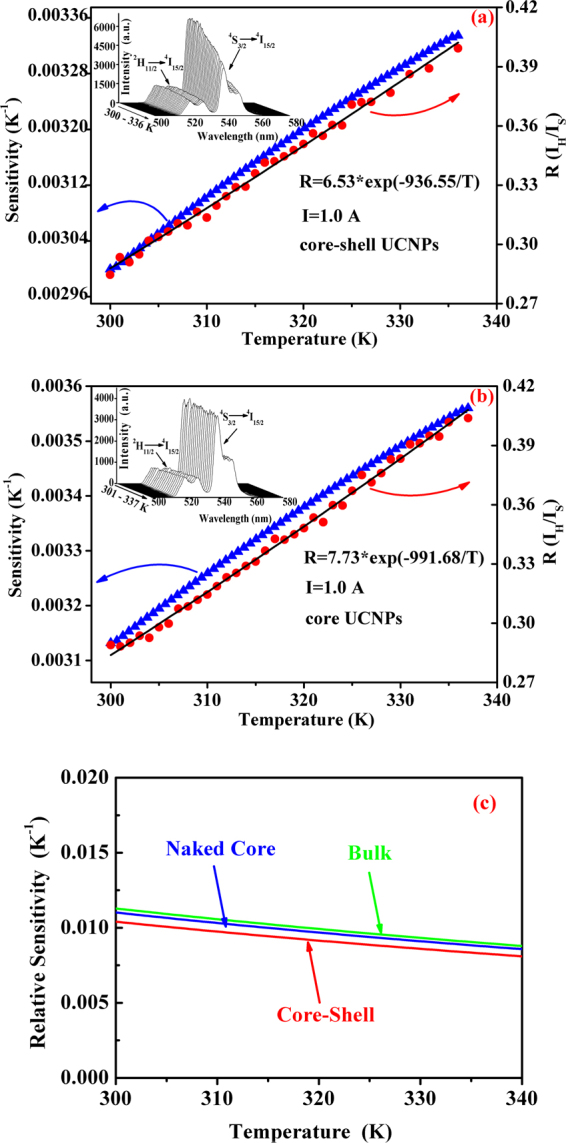
Figure 4.

Dependence of green emission intensity ratio (IR/IS) (•) and sensitivity (▴) on sample temperature, the solid curves represent the fitting curves of experimental data to equation (1) (a) for NaYF4:Er3+/Yb3+@ NaYF4:Tm3+/Yb3+ core-shell particles and (b) for NaYF4:Er3+/Yb3+ particles. The inserts show the upconversion spectra for both the samples measured at different temperatures. (c) Shows the dependence of relative sensitivities for the naked core, core-shell structure and the bulk on the temperature.
