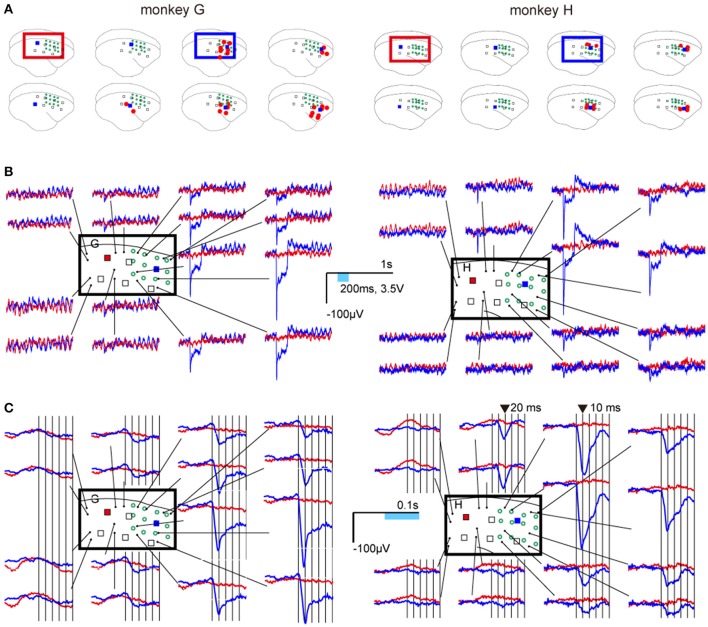
Figure 3.
Neural responses to photostimulations. (A) Locations of ON-LEDs (blue squares) and electrodes showing statistically significant changes in neural activity (red dots; adjusted p < 0.001). The open green circles indicate virus injection sites. (B) Examples of event-related potentials (ERPs). Blue and red lines show the average waveforms of responses to LED5 in the injection area (blue square) and to LED1 in an area that was not injected (red square), respectively. (C) Temporally magnified views of the ERPs. The ERPs 50 ms before and after stimulus onset are shown for LED5 and LED1. The vertical bars indicate each 10 ms after stimulus onset.

