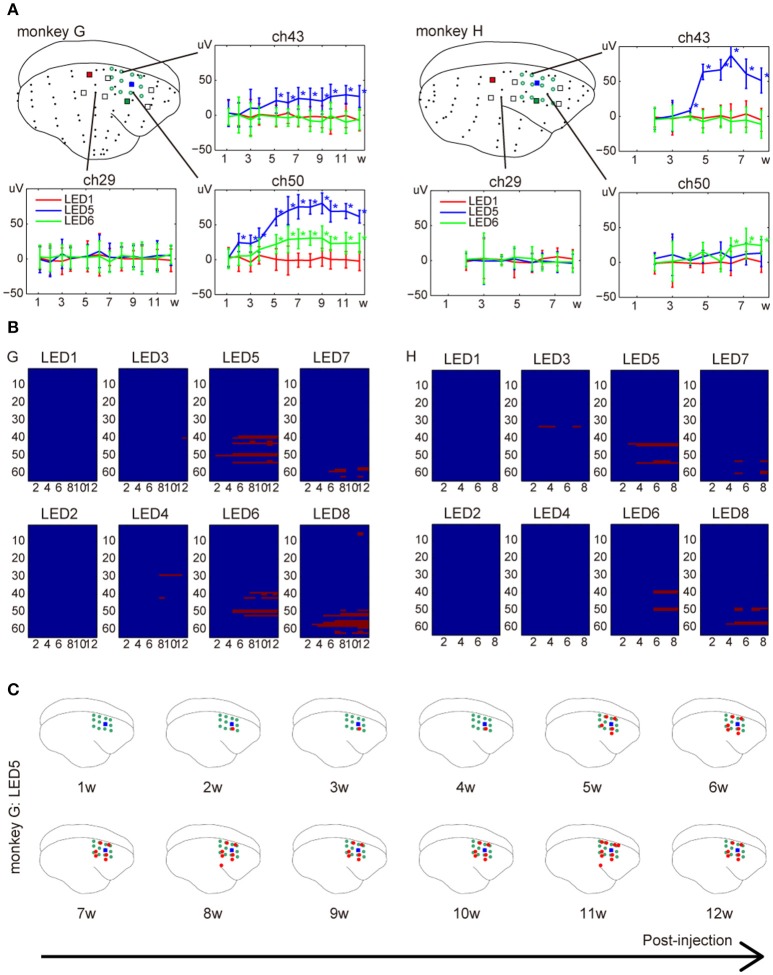
Figure 5.
Development of responses over the week following injection of AAV-ChR2V. (A) Changes in amplitude. The error bars show confidence intervals. The asterisks indicate significant responses (adjusted p < 0.0001). (B) Changes in spatial distribution. The x-axis represents weeks and y-axis lists labels of ECoG electrodes. The red pixels indicate electrodes that showed significant responses at the given week after the injection. (C) An example of the spatial distribution at different weeks after the injection. Data were acquired from monkey G.

