
Fig. 1.
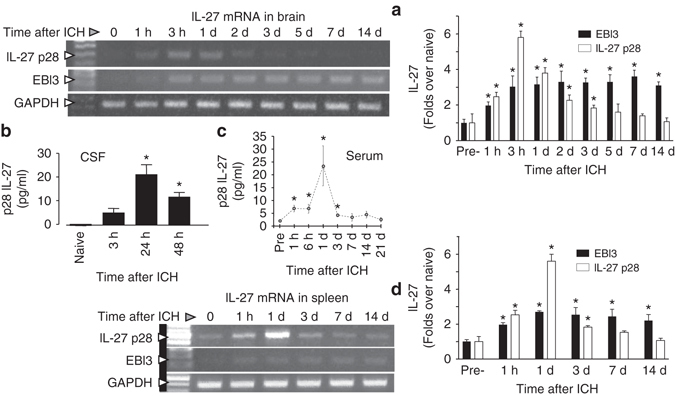
Increased IL-27 production after ICH. a Photograph of representative gels demonstrating temporal changes of IL-27 p28 and EBI3 mRNA in the ICH-affected corpus striatum, at 0 h (sham control) and 1 h to 14 days after ICH in SD rats, which was assessed using RT-PCR, and (a, right panel) a bar graph of densitometrical quantitation. GAPDH was used as an internal control. The data were calculated as mean ± SEM (n = 4). b Bar graph of IL-27 p28 protein levels in CSF in naïve rats and in rats at 3, 24, and 48 h after ICH. The data were calculated as mean ± SEM (n = 3/time point). c Bar graph showing timecourse of IL-27 p28 protein levels in blood serum at 1 h to 21 days after ICH in C57BJ6 mice. The data were expressed as mean ± SEM (n = 5). d Photograph of a representative gel demonstrating temporal changes in IL-27 p28 and EBI3 mRNA in the spleen of rats subjected to ICH, assessed using RT-PCR, and (d, right panel) a bar graph of densitometrical quantitation. GAPDH was used as an internal control. The data were calculated as mean ± SEM (n = 4). *p ≤ 0.05, compared with the Sham group (0 h) for all the panels. The p-value in this figure was generated using one-way ANOVA followed by Newman–Keuls post-test