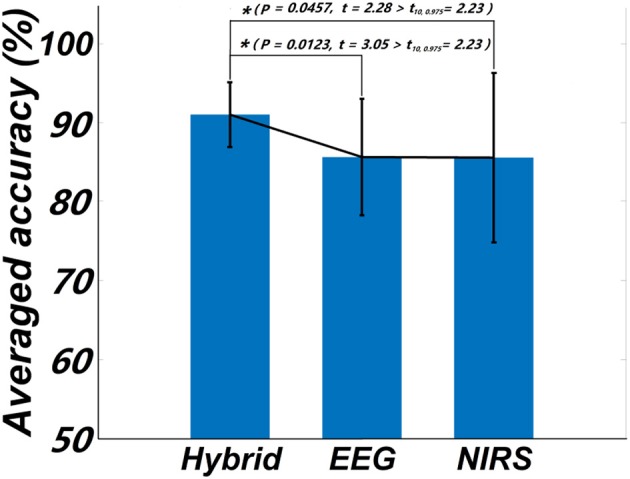
Figure 6.

Statistical plot of the classification accuracies obtained from the three feature sets, respectively. The asterisk “*” indicates a significant difference (p < 0.5, t10, 0.975 denotes the critical value with 10 degree of freedom and significant level = 0.05).
