
Figure 4.
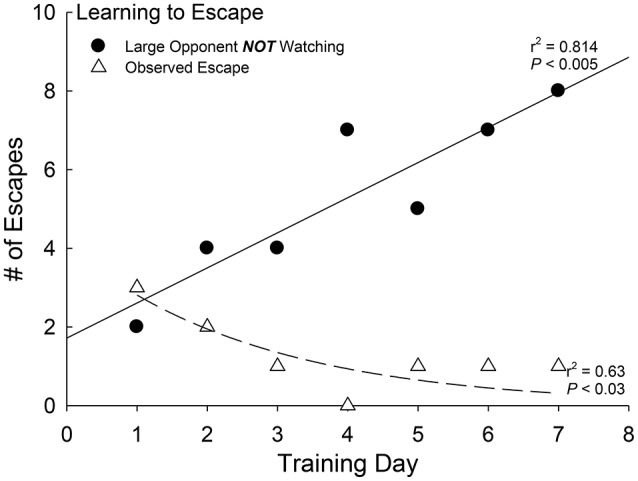
Social learning precedes efficient escape. Positive linear regression between the frequency of unobserved (larger aggressor is incapable of viewing the test fish (N = 10) and the escape route) escapes and days of social interaction experience (black dots, solid regression line; r2 = 0.814, P < 0.005). Negative curvilinear regression between the frequency of observed escapes (by larger patrolling aggressor) and number of days of experience (each with a novel aggressor) of social interaction (white triangles, dashed regression line; r2 = 0.64, P < 0.03).