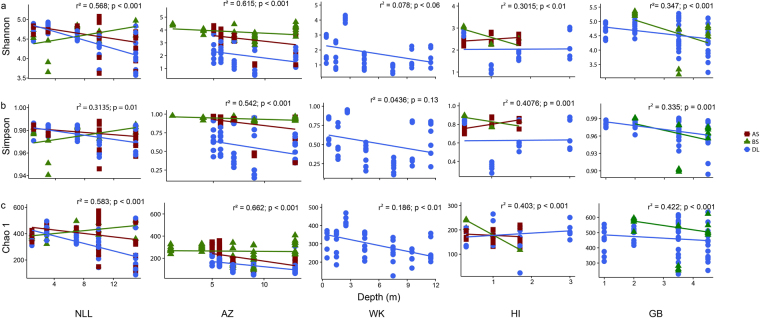
Figure 4.
Shannon, Simpson and Chao1 indices for all the different sites. AZ= Amsterdam Zeeburgertunnel, NLL= Nieuwlekkerland, HI= Hollandse IJsselkade, GB= Giessenburg, WK= Westerkade. Blue dot= deposition layer, red box = attached soil, green triangle = bulk soil. Lines correspond to linear models of diversity indices according to depth for each sampling type. Coefficients of linear regression (r2) refer to the amount of variance explained by the model with it correspondent value of significance (p-value).

