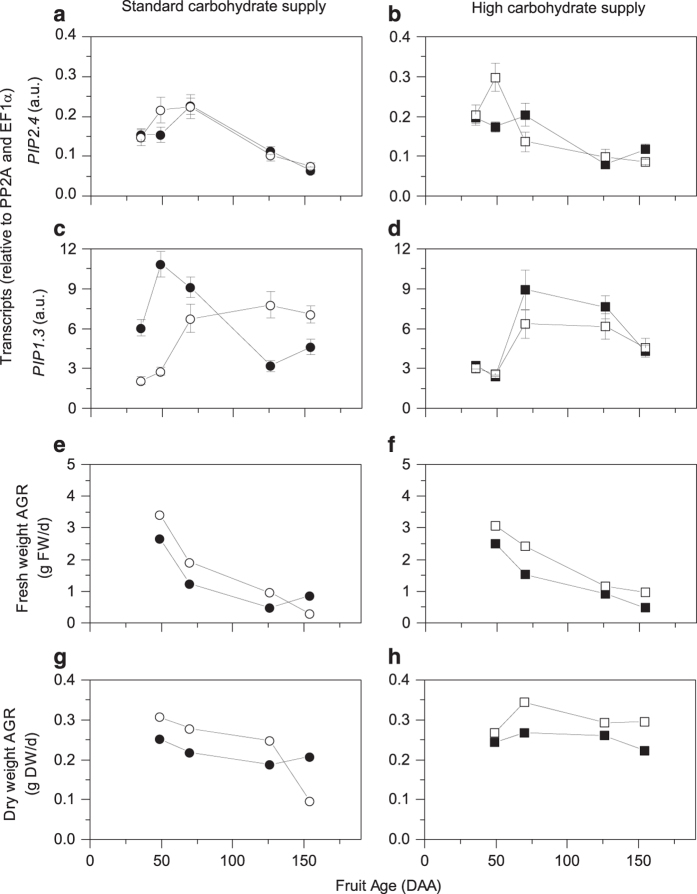
Figure 5.
Aquaporin PIP2.4 (a, b) and PIP1.3 (c, d) transcripts, and absolute growth rates (AGR) for fresh weight (e, f) and dry weight (g, h) during development of ‘Hayward’ fruit grown at two different carbohydrate supplies and with or without CPPU treatment. Circles represent standard carbohydrate supply and squares represent high carbohydrate supply. Closed symbols are untreated fruit and opened symbols are CPPU-treated fruit. Values are averages ±s.e. of the mean. n=4. a.u., arbitrary unit; DAA, days after anthesis.

