Fig. 4.

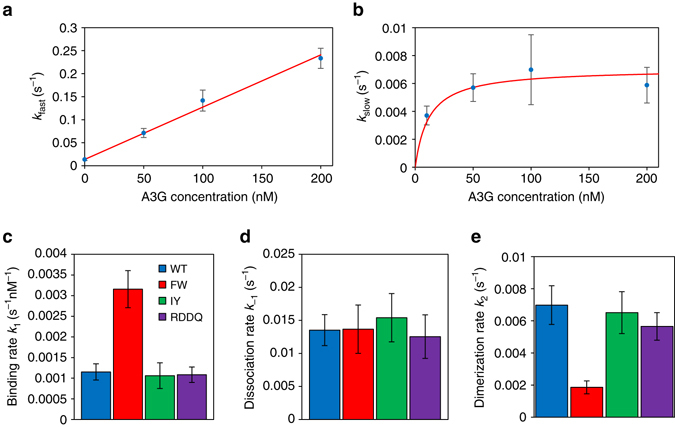
Measured rates of binding and oligomerization of A3G on ssDNA. a, b fast and slow binding rates for WT as a function of concentration. The data point 0 nM is the average single exponential rate fit to dissociation curves (Fig. 3b). All other data points are the average fast (a) and slow (b) exponential rates fit to incubation curves at varying WT A3G concentrations. The expected behavior of k fast and k slow are plotted (red lines) based of the derived values of k 1, k −1 and k 2. k fast is linear with concentration and k slow saturates at high concentrations (ck 1≫k −1). c–e Concentration independent, bimolecular binding rate k 1, unbinding rate k −1, and rate of oligomerization k 2 for WT A3G and mutants. The NTD mutant (FW) binds to ssDNA at an increased rate but forms oligomers much more slowly than the WT and CTD mutants. All error bars are SEM based on at least three independent experiments and resulting fitting parameters per condition
