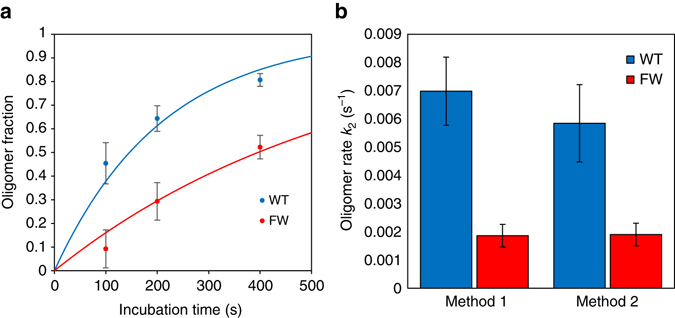
Fig. 5.

Measured oligomerization rate based on A3G in a dissociable state over time. a Fraction of bound A3G in the stable oligomer state as a function of incubation time at 50 nM. Values are calculated by dividing the amount of A3G that unbinds in buffer by the original amount of A3G after incubation (A dis and A total from the fitting of dissociation curves). WT A3G transitions to the oligomer state more quickly than FW mutant. An exponential decay function is fit to the data points to find an oligomerization rate. b Comparison of calculated oligomerization rate k 2 using the slow rate from the binding curve fit (data from Fig. 4) and this second method examining the amount of A3G that unbinds as a function of time. All error bars are SEM based on at least three independent experiments per incubation time
