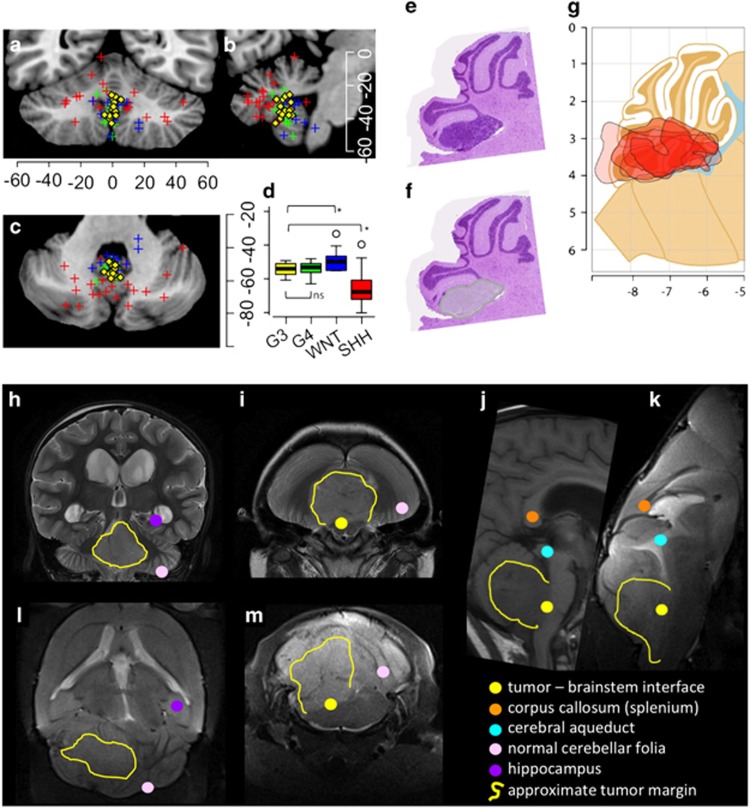
Figure 2.
Localization of the Blbp-MYC mouse model and human MBG3. (a–d) Tumor-center location of human G3 (n=16, yellow) tumors in the standard atlas space, plotted along with SHH (n=22, red), WNT (n=13, blue) and G4 (n=19, green) tumors. Data are shown on atlas planes at the approximate center of the MBG3 tumor distribution: (a) coronal at y=−56, (b) sagittal at x=5 and (c) transverse at z=−35. Coordinate units are mm. The anterior–posterior location (vertical axis in c) varied with subtype (d, P<10−5) and G3 location was distinct from SHH (P=0.0005) and WNT (P=0.008), but not G4 (P=0.63). (e–g) Heat map of Blbp-MYC MB tumors (n=6). Tumors were outlined on representative H&E-stained sections (e and f) and overlayed on a parasagittal plane at x=0.12 mm (g) from the Franklin and Paxino brain atlas.28 Coordinates units are mm relative to Bregma, and color indicates cumulative number of tumors. The rostral–caudal orientation of the atlas slice is reversed for comparison with the human atlas. (h–m) Representative MRI imaging of 4-year-old human MBG3 patient (h–j) and 57-day-old mouse bearing a tumor (k–m). Colored dots highlight points for comparison of the anatomic similarity of tumor localization that was apparent in 2/6 Blbp-MYC MB studied with MRI.

