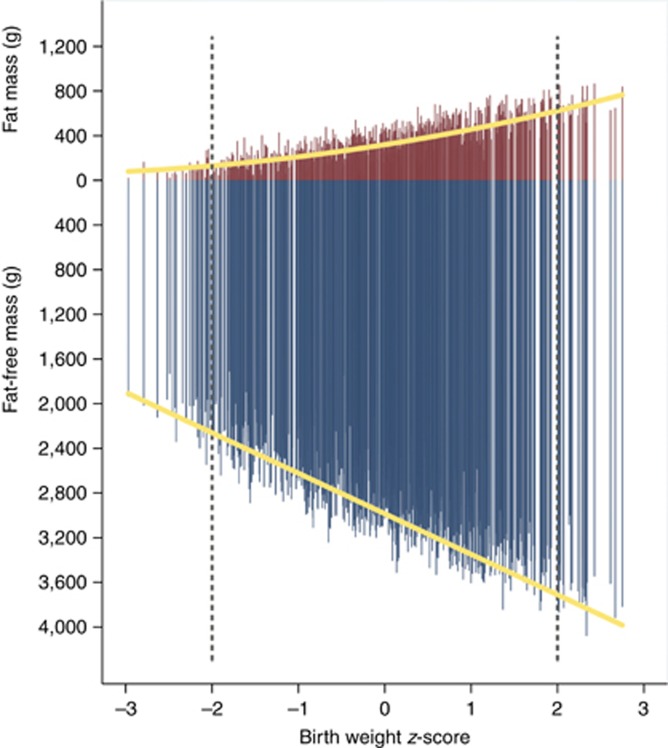
Figure 2.
Individual measures of fat mass (red bars) and fat-free mass (blue bars) for 501 boys and 518 girls in the Newborn Body Composition Study by their birth weight z-scores. The dashed lines indicate 2 SDs. The mean (SD) for fat mass was 104 g (66), 335 g (158), and 670 g (110) for the <−2, −2 to 2, and >2 SD groups, respectively; mean (SD) for fat-free mass was 2,083 g (190), 2,851 g (385), and 3,633 g (233) for the <−2, −2 to 2, and >2 SD groups, respectively. Superimposed is the average change across birth weight z-score (yellow lines).

