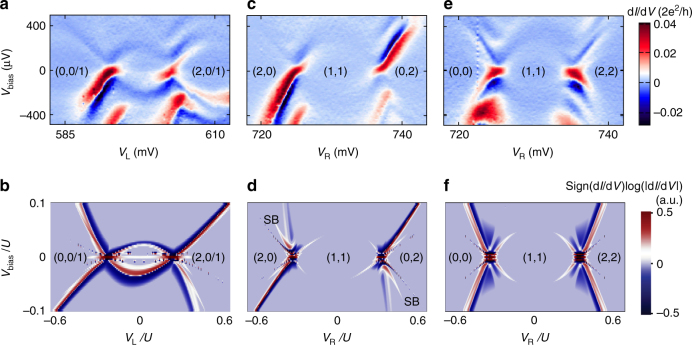
Fig. 3.
Bias spectroscopy of Andreev molecular states. a, c, e Source-drain bias spectroscopy along various cuts depicted by the dashed-line arrows in Fig. 2c, i.e., right dot is fixed to 0/1 degeneracy point and left dot is swept in a, along detuning in c, and along energy level shift axis in e (see additional complementary data in the Supplementary Fig. 4). Both V L and V R are tuned in each panel, but either V R or V L is used to denote the x-axis. Parity configurations indicated in brackets in each region. b, d, and f, Corresponding numerically computed differential conductance as function of left dot chemical potential with fixed right dot chemical potential b, along detuning d and energy level shift axis f. “SB”s in d mark the numerically reproduced spin blockade corners at positive and negative biases

