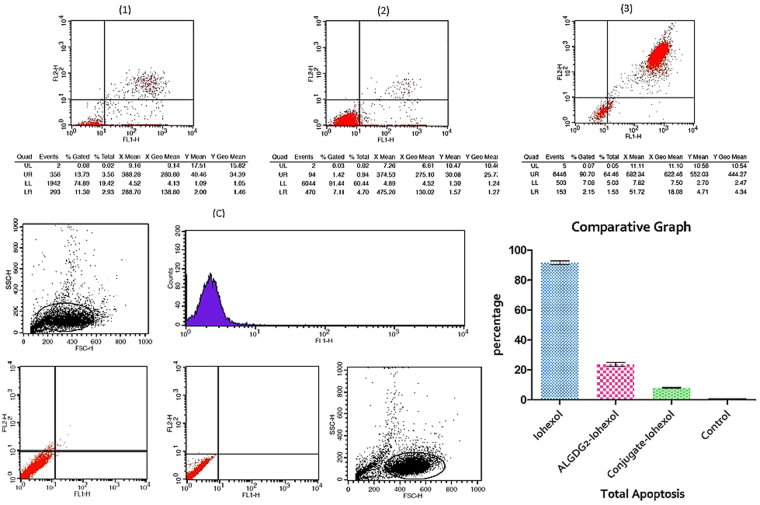
Figure 7.
Flow cytometry and comparative graph: apoptosis/necrosis detection of HEK-293 cells (nucleolin−) using flow cytometry. (1) ALGDG2-Iohexol, (2) Apt-ALGDG2-Iohexol (3) Free Iohexol. (C) Controls: (right) treated unstained and (left) untreated unstained. Comparative graph shows the effect of three different compounds on the HEK-293 cells. Data are presented as mean ± SEM. Based on statistical analyses, all three components have significant differences in total apoptotic cells from the untreated control cells (p value < 0.05).

