Fig. 1.

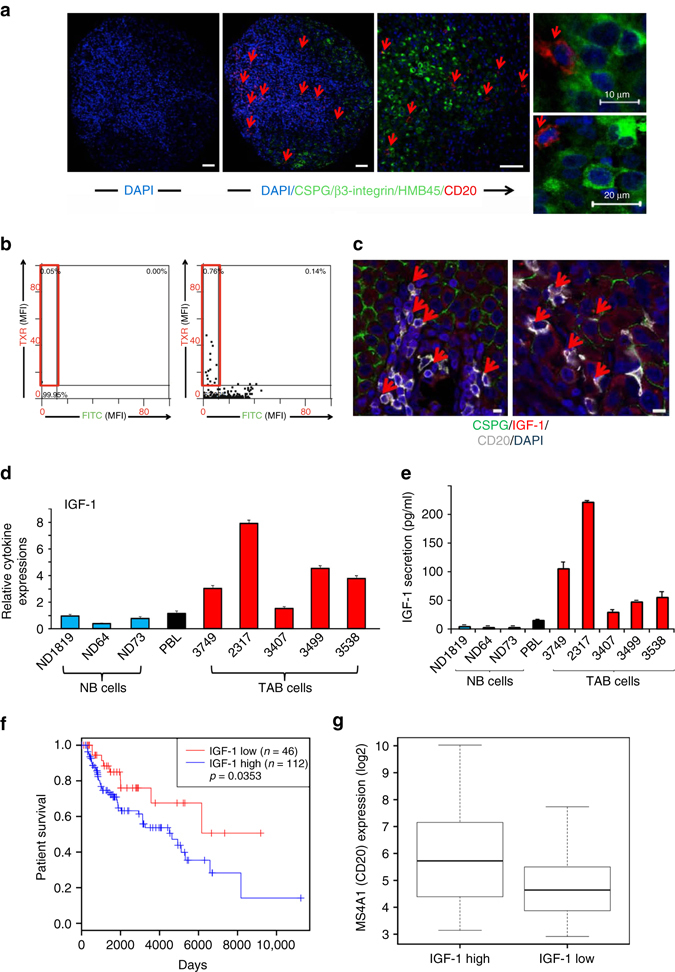
a–g Prevalence of CD20+ B cells in metastatic melanoma tissues and increased IGF-1 expression in TAB cells. a, b Presence of CD20+B cells. Representative immunostaining (TMA, 79 cores from 48 patients) for CD20 (red) and a three melanoma marker combination (CSPG/β3 integrin/HMB45 (green)) plus DAPI nuclear stain (blue). a Left and middle panels: sample with predominant distribution of CD20+, triple melanoma marker-ve B cells in the tumor stroma (red; left panel: isotype control). Right panel: close-up with infiltration of single CD20+ B cells (red) among melanoma cells (green). Scale bars: 50 μm. Far right 2 panels: CD20+ B cells are DAPI+ and triple melanoma marker-ve. Scale bars: 10–20 μm. b Tissue FAXS analysis, the MFI was displayed in scattergrams for FITC-labeled CSPG/β3 integrin/HMB45+ and Texas red (TXR)-labeled CD20+ cells. Cutoff values were set based on isotype control staining (left panel). CD20+ B cells gated as CD20+, triple melanoma marker-vecells (right panel, red frame). c Representative immunostainings from additional metastases (six patients’ biopsies) stained for IGF-1 (red) in CD20+ (grayish white) CSPG-ve (green) B cells. Scale bars: 10 μm. d, e Immortalized B cells (48 h, B-cells-only cultures) from melanoma tissues (n = 5; TAB cells; red bars) show increased mRNA/protein expression of IGF-1 when compared with immortalized B cells from peripheral blood (n = 3; NB cells; blue bars) and pooled total PBL of healthy volunteers (black bars). d mRNA transcripts were determined by qPCR with levels indicated as RQ values normalized to GAPDH and relative to control normal B cells from healthy volunteers. Bars represent mean + SE of duplicate samples. Results are representative of three independent experiments for each sample. e B-cell supernatants (48 h, B-cells-only cultures) were used for protein expression of IGF-1 (ELISA). Bars represent mean + SE of duplicate samples. f, g TCGA-SKCM patients’ data set analyses (n = 473). f Kaplan–Meier survival curves of 158 melanoma patients with tumors containing a high lymphocyte infiltrate (above median, see Methods) who were divided into high and low IGF-1 expression (by median). Log-rank test shows poor OS in patients with high IGF-1 expression. g Box plots showing significantly (p < 0.0001, t-test) increased B-cell (MS4A1, CD20) expression levels in melanomas with high tumor IGF-1 expression
