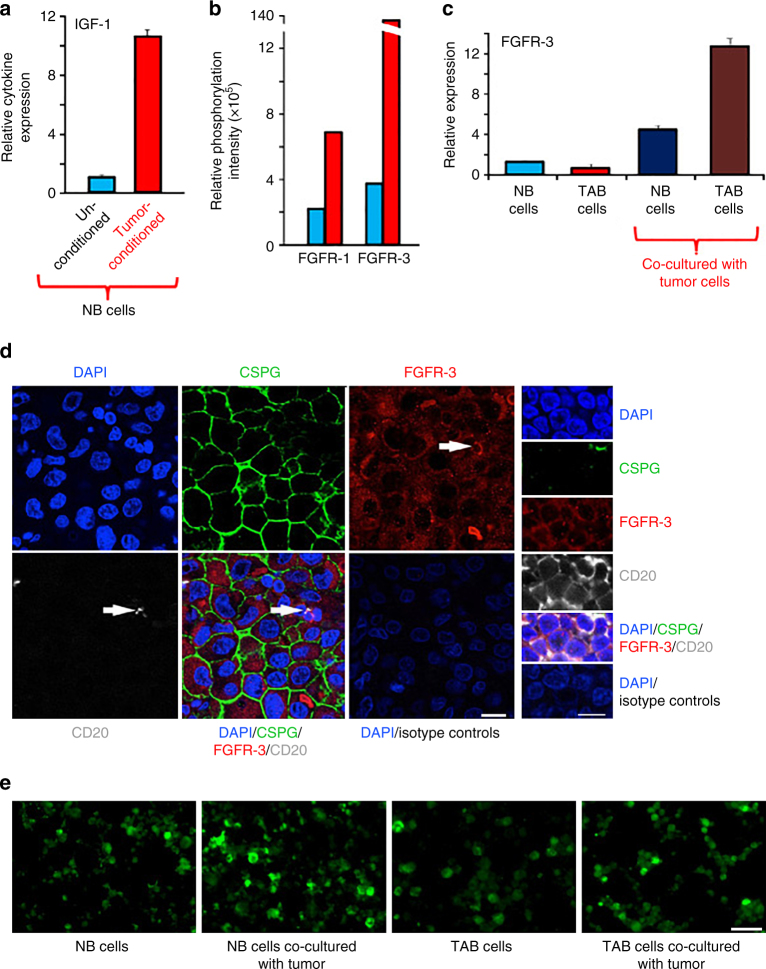
Fig. 2.
Melanomas convert normal B cells to a tumor-associated phenotype with high growth factor production for tumor stroma-tumor cell cross-talk. a NB cells from healthy volunteer (NB cells) co-cultured with melanoma tumor lineWM3749 (tumor-conditioned; red bars) show increased expression of growth factors and inflammatory cytokines, including IGF-1 (see Supplementary Fig. 4 for fresh NB cells), IL-1α/β and PDGF-A/-B (Supplementary Fig. 3b) when compared with unconditioned NB cells from the same healthy volunteer (blue bars). The B cells were harvested after 14 days (viability > 90%) and were analyzed by qPCR as in Fig. 1d. Results are representative of 2 independent experiments. b–e Upregulated protein or mRNA expression and phospho-signaling of FGFR-3 in B cells and melanoma cells as determined by qPCR or immunostaining. b NB cells co-cultured with melanoma cells for 48 h (red bars) show increased phosphorylation of FGFR-1 and FGFR-3 when compared with unconditioned B cells (blue bars) as determined by phospho-RTK array analysis. c NB- (dark blue bar) and TAB cells (dark brown bar) co-cultured with melanoma cells (WM3749) for 48 h show increased FGFR-3 expression compared with unconditioned normal (blue bar) or TAB cells (red bar); qPCR as in Fig. 1d. Results are representative of two independent experiments. d Detection of FGFR-3 expression in TAB cells in additional 10 metastatic melanoma patients’ biopsies by laser scanning microscopy. The 6 larger images on the left show FGFR3 expression in a CD20+ (grayish white) CSPG-ve (green) B-cell (white arrow) as well as in melanoma cells (CSPG+; green). The right panel is a close up into a CD20+ (grayish white) lymphocyte cluster of the tumor stroma in direct apposition to melanoma cells (part of a melanoma cell can be seen in the upper right corner by staining for CSPG; green). Nuclei were counterstained with DAPI (blue). Isotype-matched antibodies were used as a control. Representative images are shown. Scale bars: left 25 μm, right 10 μm. e Detection of FGFR-3 expression in NB or TAB cells after co-culture (48 h) with melanoma cells (WM3749) detected by immunostaining. Cytospin preparation of normal B or TAB cells after co-culture with melanoma cells show upregulation of FGFR-3 as determined by staining of B cells with rabbit anti-FGR-3 antibody followed by Alexa-Fluor 488 conjugated anti-rabbit antibody. Scale bars: 40 μm. Images were captured using Nikon fluorescent microscope

