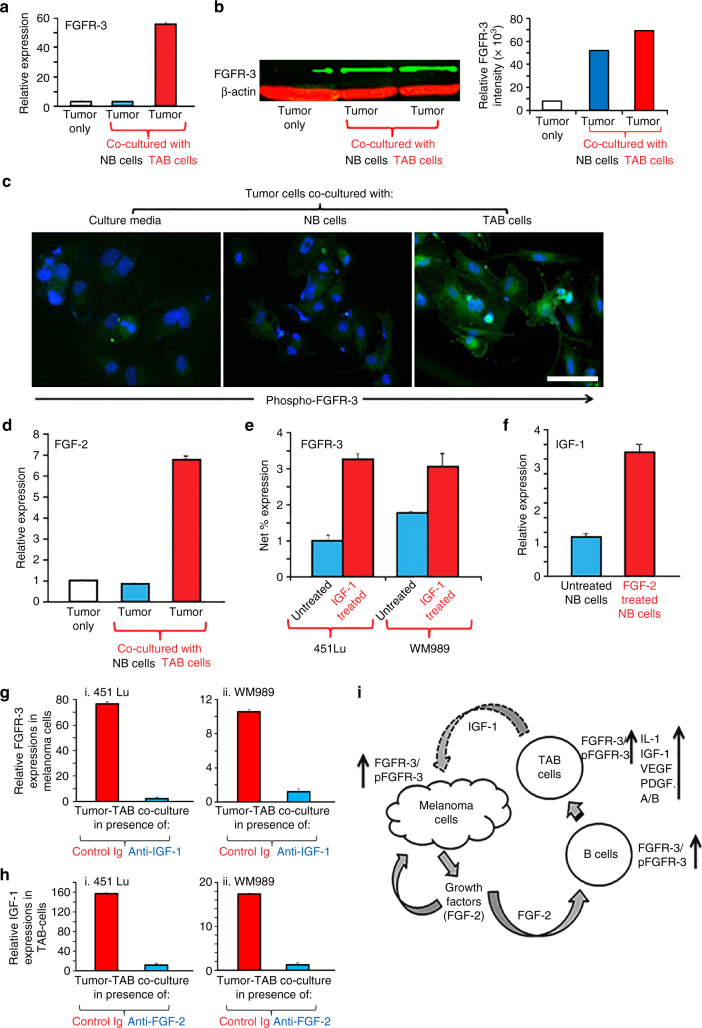
Fig. 3.
TAB cells modulate melanoma cells to express FGFR-3 and its ligand FGF-2 for tumor stroma-tumor cell cross-talk. a WM3749 co-cultured (72 h) with TAB cells (red bar) show increased FGFR-3 mRNA expression when compared with tumors only (open bar) or co-cultured with NB cells (blue bar). b Lysates obtained from pools of melanomas co-cultured (72–120 h) with NB- or TAB cells were probed in western blot with anti-FGFR-3 antibody (left panel), results expressed as relative intensity after β-actin normalization (right panel). c Melanoma cells co-cultured with TAB cells (72 h) show increased phospho-FGFR-3 expression (right panel; immunofluorescence assays) when compared with melanoma cells alone (left panel) or melanoma cells co-cultured with NB cells (middle panel), scale bars: 40 μm, images captured by Nikon inverted microscope. d Melanoma cells co-cultured with TAB cells (red bar) show increased FGF-2 mRNA expression when compared with melanoma cells alone (open bar) or melanoma cells co-cultured with NB cells (blue bar). e 451Lu and WM989treated with IGF-1 (25 ng/ml/daily for 5 days; red bar) show increased FGFR-3 expression when compared with untreated controls (blue bar), flow cytometry results expressed as net % expression of control antibody. IGF-1 treated melanoma cells (red bars) show higher expression of FGFR-3 compared with untreated cells (blue bars). Bar represents mean + SD of replicate samples. f NB cells treated with FGF-2 (10 ng/ml/daily for 4 days; red bar) show high IGF-1 mRNA expression relative to untreated NB cells (blue bar). g 451Lu and WM989 co-cultured (72 h) with TAB cells in the presence of an anti-IGF-1 neutralizing antibody (10 μg/ml) show decreased FGFR-3 mRNA expression in tumor cells (blue bar) when compared with controls (red bar). h TAB cells co-cultured (72 h) with 451Lu and WM989 in the presence of an anti-FGF-2 neutralizing antibody (1 μg/ml) show decreased IGF-1 mRNA expression in B cells (blue bar) when compared with controls (red bar).Experiments in a, d and f–h were performed using qPCR. In Figures a, d–h, bars represent mean + SE of duplicate samples and are representative of at least two independent experiments. i Summary of cross-talk between melanoma and B cells: FGF-2 is constitutively expressed by tumor cells, released into the microenvironment to bind FGFR-3 on the B cells, activated B cells express increased levels of pro-inflammatory cytokines. IGF-1 released by TAB cells modulates tumor cells to increase their growth, heterogeneity and therapy resistance

