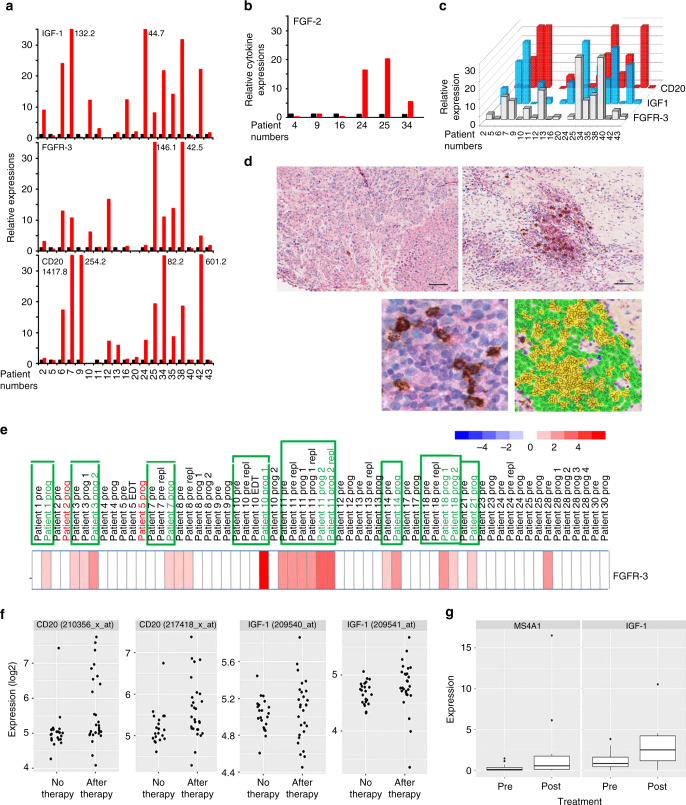
Fig. 7.
Increased expression of IGF-1, FGFR-3, its ligand FGF-2 and CD20 in tumor tissue obtained on treatment with BRAF and MEK inhibitors. a, b Tumor tissue from melanoma patients (n = 20) after kinase inhibitor therapies (red bars) show increased transcript levels of IGF-1, FGFR-3, CD20, and FGF-2 b when compared with same patients’ pre-treatment tumor tissues (black bars). mRNA transcripts were determined by real time qPCR (as described in Fig. 1 legend) with levels indicated as RQ values normalized to an endogenous control (GAPDH) and relative to pre-treatment cDNA samples. c Transcript levels of IGF-1, FGFR-3, and CD20 of melanoma patients’ cDNA samples on treatment showed a correlation with each other (IGF-1 and FGFR-3 (Spearman’s r = 0.6936; p = 0.0376); IGF-1 and CD20 (Spearman’s r = 0.5074; p = 0.0020)). d Increased presence of CD20+ B cells co-stained with IGF-1 in tumor sections obtained from patients undergoing treatment with kinase inhibitors. Representative immunostaining of a patient’s tumor section pre- (left top panel) and on-therapy (bottom left panel) with BRAFi/MEKi showing co-staining of IGF-1 (red) and CD20 (dark brown). Magnified view of the co-staining is shown on top right panel and multi-spectral analysis confirming the co-localization of IGF-1 and CD20+ B cells is shown in bottom right panel (yellow). Scale bars: 100 μm. e Increased RNA expression of FGFR-3 in 8/21 progression biopsies (green frame) obtained post BRAF inhibitor (dabrafenib) therapy when compared with pretreatment biopsies. Gene expression analysis was performed using GEO data set (GSE50509). f Gene expression analysis of GEO data set (GSE8401, n = 52 metastatic melanoma samples): scatter plots showing significantly higher CD20 RNA expression (two probes; left two panels; p = 0.0185 and p = 0.0125; t-test) (see also Supplementary Fig. 11) and a trend towards higher IGF-1 expression (two probes; right two panels) in therapy resistant samples. g RNA-seq data were downloaded from EGA under accession number EGAS00001000992 (n = 38 melanoma samples, 27 patients) and the data from multiple probe sets are summarized into scatter plots. Significantly higher CD20 (MS4A1; left panel; p = 0.0206) and IGF-1 RNA expression (right panel; p = 0.0403; t-test) are seen in BRAFi-resistant melanomas

