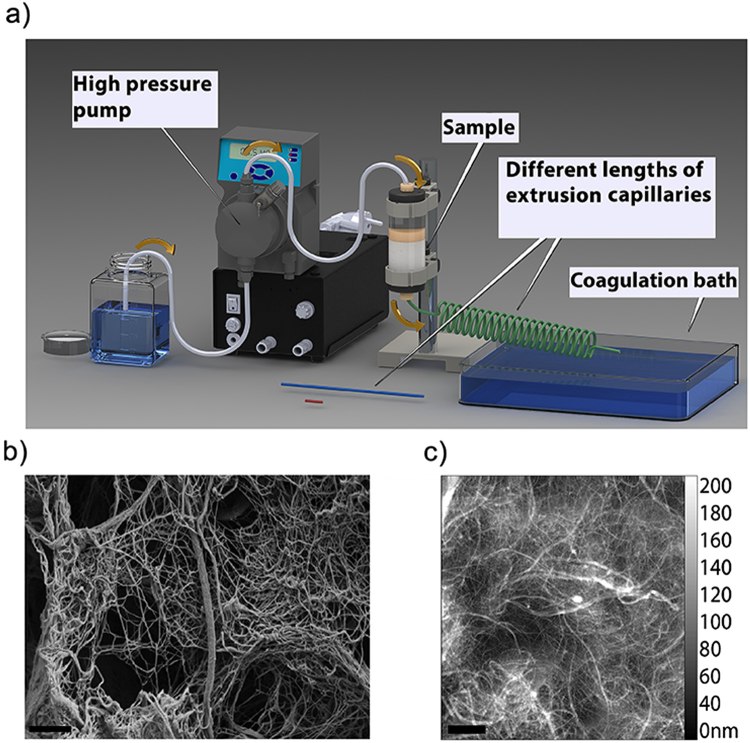
Figure 1.
The scheme of the spinning device and SEM and AFM images of the starting CNF. (a) The capillary length, the diameter, and the flow rate were modified, (b) SEM high magnification image of cellulose nanofibrils (CNF), (c) tapping mode AFM. The morphology and size distribution of the CNF were characterized by AFM and show fibrils with diameters in the range of 5 to 500 nm and lengths up to several micrometers since the ends of fibrils were not recognizable in the AFM topography images. Scale bars are 1 μm in both images.

