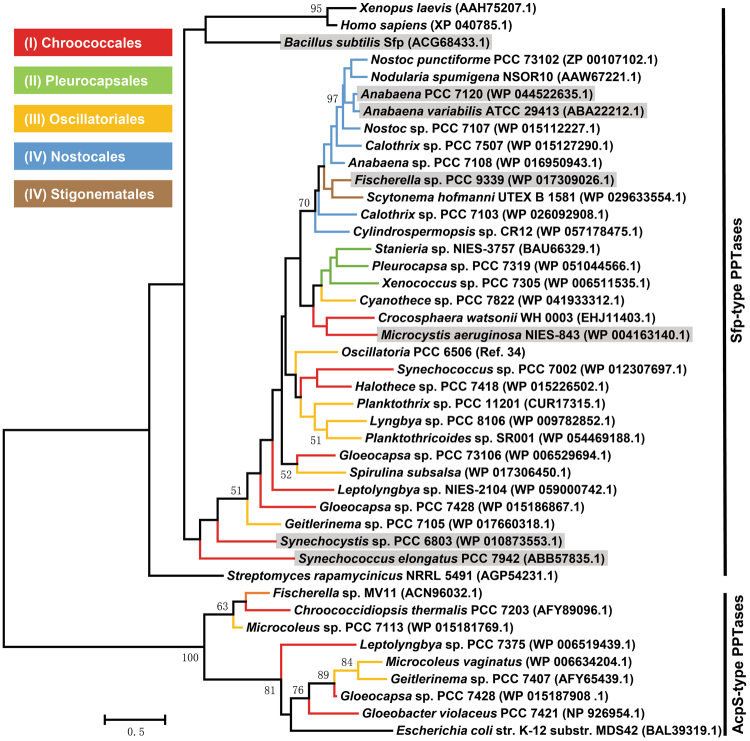
Figure 1.
A maximum-likelihood phylogeny based on selected cyanobacterial PPTases. A phylogenetic tree was generated using MEGA7 maximum-likelihood method. Enzymes were shown as the names of corresponding strains with NCBI accession numbers given in parenthesis. Branches were color-coded according to morphological subsections of cyanobacteria. Branch length is proportional to the amount of genetic change. Significant bootstrap values (over 500 of 1,000 repeats) are shown. PPTases with shaded taxa names were selected for the characterization in this study.

