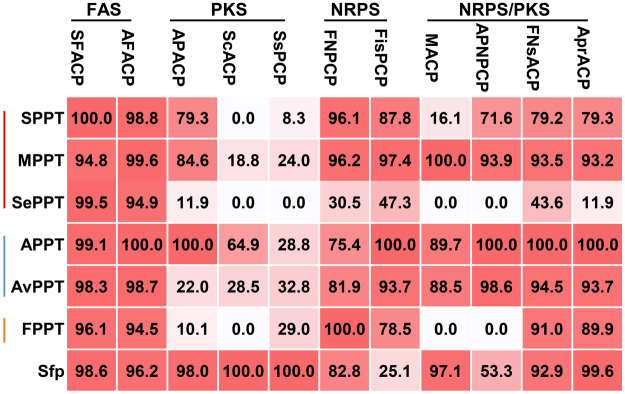
Figure 3.
Relative activities of seven PPTases toward 11 CP substrates. The activity of the most active PPTase of a CP was set as 100%, and those of other PPTases toward the same substrate were normalized as shown in the heatmap. The data represented the mean of three independent experiments. Red to white color indicated the high to low relative activities of PPTases. CPs were grouped according to the biosynthetic pathways while cyanobacterial PPTases were organized by the subsections of sources.

